NNadir
NNadir's JournalCAISO: Heat Wave in CA, So Called "Renewable Electricity" Matched Gas Electricity for 10 Minutes.
This is a follow up of my thread of yesterday, about the extreme heat being experienced in California and how so called "renewable energy" is faring on addressing the electricity demand associated with the need for cooling.
That thread is here: Looking at CAISO demand and supply of electricity during extreme California temperatures.
Yesterday I focused on the weather in San Bernadino, where the high temperature yesterday was 102°F (38°C) and mentioned Indio, California, one of California's fastest growing cities, albeit with a relatively small population for California of around 80,000. Today in San Bernardino, the predicted high will be again 102°F (38°C) at 3 pm. Indio is cooling down compared to yesterday, where temperatures of over 120°F (49°C). Today's high will "only" be 118°F (48°C).
Humans cannot survive temperatures much higher than 120°F (49°C) without drinking copious amounts of water. A human trial with 10 young healthy male volunteers, evaluated strategies for survival at lower temperatures (43.0 ± 0.5 °C) than we're seeing in Indio, in a 90 min trial, in the absence of air conditioning:
Intermittent wetting clothing as a cooling strategy for body heat strain alleviation of vulnerable populations during a severe heatwave incident (Song, Wang, Zhang, Journal of Thermal Biology 79 (2019) 33–41).
The subjects, all men in their early 20s dressed in light clothing, all lost about 120 - 130 grams of water to evaporation and produced about 350 grams of sweat in this period.
The introduction to that paper had some fun text about the death toll associated with heat waves, albeit assuredly not in any way a comprehensive accounting:
In extremely hot environments (Tair? 40 °C), people like the poor and the homeless in backward areas do not have a chance to access air-conditioning. Hence, they have a high risk of suffering heat stress during prolonged heatwave incidents. In fact, statistical data showed that those populations account for a large proportion of heat-induced death tolls (Åström et al., 2011, Gronlund, 2014, Gubernot et al., 2014). Besides, extreme heatwaves put strains on the electrical power grid and cause power outages in some regions which renders electrically powered cooling devices (e.g., air-conditioning, electric fans and water pumps) useless...
Power outages in these conditions can kill a person.
Of course, people don't often discuss the death toll associated with heat waves. Most people, in my experience, would rather talk about the 2011 Earthquake and Tsunami in Japan in which 20,000 people died from seawater, although the deaths from seawater are in no way as interesting as the possibility that someone some day somewhere may die from radiation that leaked from nuclear reactors destroyed by the Tsunami.
I'm frequently told that nuclear power is "too dangerous," by people who apparently believe that climate change is not "too dangerous." By contrast, I've been hearing for most of my adult life - I'm decidedly not young - that so called "renewable energy" will save the day. It hasn't saved the day and it isn't saving the day, but in these times, we like to substitute faith for facts, and who am I to argue with lies in the age of popular lies, where the lies we tell others and the lies we tell ourselves are celebrated?
California is often presented as a so called "renewable energy" paradise.
We are nearing the summer solstice, and of course, California is a putative solar energy nirvana in particular.
Real time data is available at the CAISO website: CAISO Website.
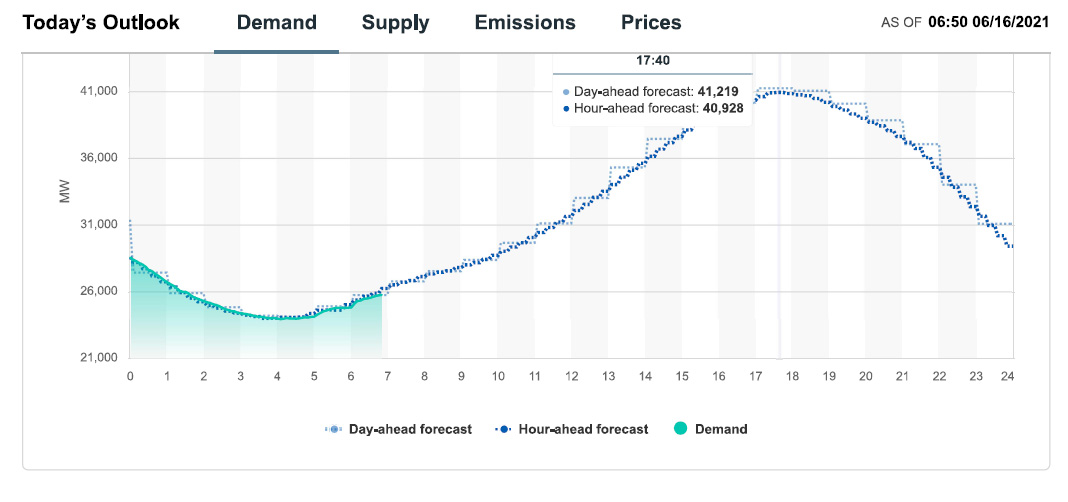
Since I check this website frequently, and have been doing so as we approach the solstice, we can expect that so called "renewable energy" will be dominated by solar production in the early afternoon. As of this writing, the current peak solar production in the entire State of California is, as of 12:10, PDT, 11,382 MW, the high, so far for the day. In the whole state, wind power is producing a total of 710 MW. The predicted peak power demand at the CAISO site for 6/17/21 is at 18:10 PDT, (6:10 PM) will be 43,048 MW, as the sun is going down, and with it, solar power production. The current demand for energy 12:20 PDT, is 35,599 MW.
People like to cheer for what so called "renewable energy" does at peaks. At no point yesterday, did all the renewable energy facilities in the entire State of California, ever, for even for a few minutes, match the power produced by burning dangerous natural gas, and dumping the dangerous fossil fuel waste carbon dioxide directly into the planetary atmosphere.
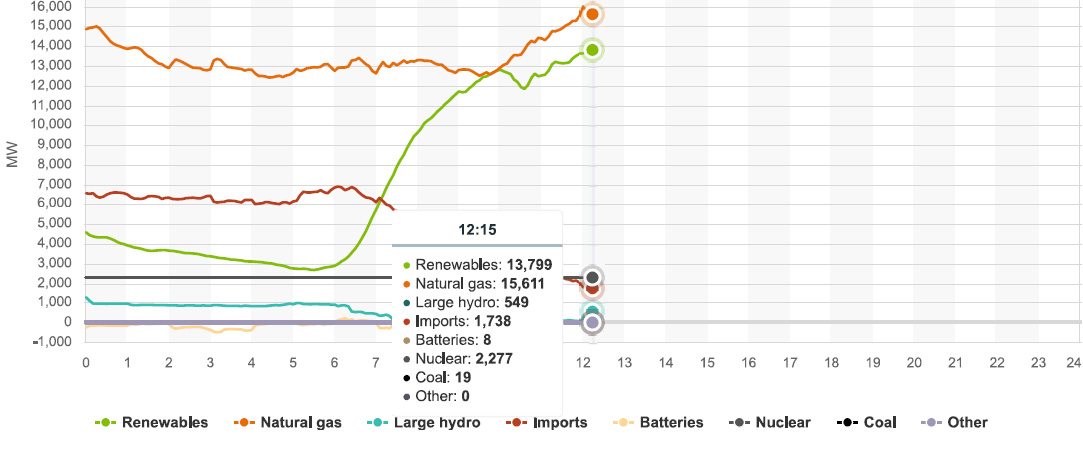
Today however, for a period of about 15 minutes, so called "renewable energy" matched the output of the dangerous natural gas plants in the state in a period between 9:45 and 9:55; at 9:55, all the so called "renewable energy" in the State of California was producing 12,756 MW, exactly equal to what dangerous natural gas was producing.
I'll pause for cheers...
After half a century of wild cheering for so called "renewable energy," it is still - I contend always will be - dependent on access to dangerous natural gas. We. Couldn't. Care. Less.
There is one nuclear plant left in California, Diablo Canyon (2 reactors). It is producing about 2,278 MW of electricity in two small buildings, more than all the wind turbines in California. The reactor came on line 36 years ago, and is functioning fine. It's reliable and predictable. No one has been killed by pollution produced by the Diablo Canyon Nuclear Plant. I contend that the used nuclear fuel stored there, all of it on site, will be a valuable resource for future generations that will be less stupid than mine has been.
Unfortunately this nuclear plant is about to close because of appeals to ignorance. That will raise the dependency of gas on California. No replacement of this valuable resource, which is at this exact point, producing more energy than all the wind turbines in the entire state, this without turning vast tracts of wilderness into industrial parks, is planned.
The nuclear plant will be replaced by dangerous natural gas. There will be lots of outright lies told to the contrary, but the plant will be replaced by dangerous natural gas.
Dangerous natural gas is not clean; it is not safe, and it releases significant amounts of the important dangerous fossil fuel waste carbon dioxide, and leaks for the transport and use of dangerous natural gas releases the second most important climate forcing gas, methane.
Graphics from the CAISO website for power production in California as of 12:15 PDT, 06/17/21:

There is a serious risk of California, particularly Southern California, becoming uninhabitable, particularly with respect to the effect of climate change, to which dangerous natural gas is a contributor, on water supplies. You may think I'm being extreme here, but I don't think so.
We're kidding ourselves if we think we're doing anything to address climate change.
History will not forgive us; nor should it.
Looking at CAISO demand and supply of electricity during extreme California temperatures.
Temperatures in parts of California today will exceed 105°F (40°C) and in places, Indio for example, will reach around 120°F (49°C). Air conditioning will be cranking up for sure, and will be working at lower efficiency.
We are nearing the summer solstice, and of course, California is a putative solar energy nirvana.
Real time data is available at the CAISO website: CAISO Website.
A short while ago, I downloaded some graphics.
Demand and demand forecast for 06/16/21:
Overall Energy Supply
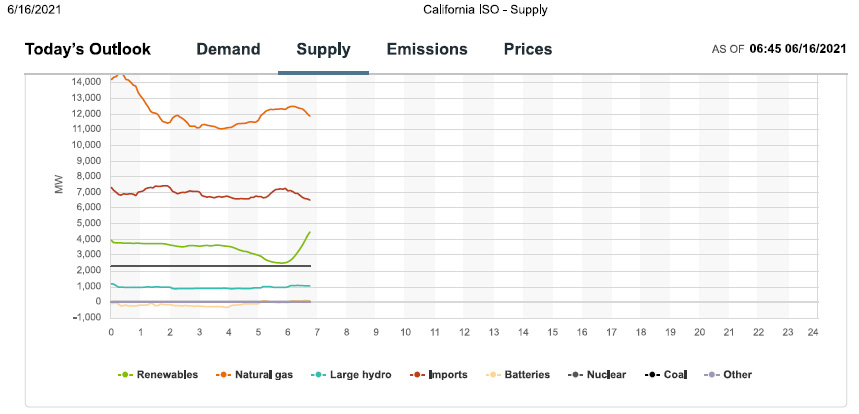
Since I check this website frequently, and have been doing so as we approach the solstice, we can expect that so called "renewable energy" will be dominated by solar production in the early afternoon, which should approach peak power of 13,000 MW.
Impressive, no?
Well, demand will peak as the sun falls, so there's that.
Not much wind is blowing this morning. Maybe it will change, who knows. When and if is not known.

Gas was dominating when I downloaded the graphics, and it will dominate near the peak.
Some people, me for instance, believe the regular occurrence of these kind of high temperature weather events is connected with climate change.
After half a century of wild cheering for so called "renewable energy," it is still - I contend always will be - dependent on dangerous natural gas.
There is one nuclear plant left in California, Diablo Canyon (2 reactors). It is producing about 2,278 MW of electricity in two small buildings, more than all the wind turbines in California. The reactor came on line 36 years ago, and is functioning fine, but well, it's being closed and no replacements are planned in California. (The production of electricity at this plant may fall slightly as the temperature rises in the afternoon, because of changes in thermodynamic efficiency connected with high temperatures, but certainly output will not fall below 2,200 MW). It's reliable and predictable.
Unfortunately this nuclear plant is about to close because of appeals to ignorance. That will raise the dependency of gas on California.
Dangerous natural gas is not clean; it is not safe, and it releases significant amounts of the important dangerous fossil fuel waste carbon dioxide, and leaks for the transport and use of dangerous natural gas releases the second most important climate forcing gas, methane.
There is a serious risk of California, particularly Southern California, becoming uninhabitable. You may think I'm being extreme here, but I don't think so.
We're kidding ourselves if we think we're doing anything to address climate change.
Indio California to see 122 degrees F on Friday.
Nice Breeze though. The all time highest temperature ever recording was 123°F
From Weather.com:
Fri 18 | Day
122°F
W 13 mph
Mostly sunny skies. Near record high temperatures. High 122F. Winds W at 10 to 20 mph.
Humidity
11%
UV Index
10 of 10
Sunrise
5:34 am
Sunset
7:58 pm
Fri 18 | Night
89°
NW 14 mph
Clear. Low 89F. Winds NW at 10 to 20 mph.
Humidity
19%
UV Index
0 of 10
Moonrise
1:23 pm
Waxing Gibbous
Moonset
1:16 am
Just checked the weather forecast for Indio California. 119F, 5 pm Tuesday.
I wonder how the date trees will fare.
828 Underground Nuclear Tests, Plutonium Migration in Nevada, Dunning, Kruger, Strawmen, and Tunnels
This is a very long post, probably not one worth reading, but it was fun to write, as in writing it, I reviewed some familiar concepts deepening my understanding and, as always, learned many new things as well, and came to some new ideas. As such, for what it's worth, I've decided to post it, as desultory and as sloppy as it is.
One of the papers I'll discuss in this post is this one: Plutonium Desorption from Nuclear Melt Glass-Derived Colloids and Implications for Migration at the Nevada National Security Site, USA (Claudia Joseph, Enrica Balboni, Teresa Baumer, Kerri Treinen, Annie B. Kersting, and Mavrik Zavarin Environmental Science & Technology 2019 53 (21), 12238-12246)
“Nevada National Security Site” is a marketing euphemistic rebranding of the nuclear weapons testing area previously known as the Nevada Test Site (NTS), and before that as the Nevada Proving Grounds. Of course the rebranding is a little absurd, since the reason for testing so many nuclear weapons there was insecurity, not security, deriving the fear that the former Soviets would have more and better nuclear weapons than “we” do, so an improved name for the site would be “Nevada National Insecurity Site.”
Anyway.
From the introductory text from the paper cited at the outset:
At the NNSS, the majority of the nuclear tests were conducted underground in silicic volcanic rocks of rhyolitic composition (75% SiO2 and 15% Al2O3), with approximately 30% conducted below the water table.(1) The high temperatures and pressures achieved during an underground nuclear explosion vaporize and melt the surrounding rock.(12) During this process, the overwhelming majority of the refractory radionuclides, including Pu, are incorporated into the melted rock,(13,14) also referred to as nuclear melt glass, which pools at the bottom of the test cavity.(12,15) The initial groundwater temperatures and temperature histories in test cavities vary substantially. The Cambric nuclear test likely returned to ambient temperatures within 10 years,(16) while other tests, such as Almendro, recorded a downhole temperature of 157 °C, 23 years after detonation.(17) Plutonium, as well as other radionuclides (e.g., 137Cs), will be released from the nuclear melt glass by dissolution during contact with groundwater.(18) Previous studies(19,20) have shown that hydrothermal alteration of rhyolitic glasses of similar composition to those found at the NNSS leads to the formation of clay (e.g., smectite/montmorillonite) and zeolite (e.g., clinoptilolite-heulandite, analcime)(4,21) secondary minerals, a fraction of which may be found in the form of colloids. Colloids, defined as particles ranging in size from 1 to 1000 nm, have low settling velocities and can remain suspended in solution for long periods of time.(22,23) At the NNSS, the presence of fractured volcanic rock, high flow rates, and low-ionic-strength groundwater enhance colloid stability and potential migration.(4,8,24,25) Although colloid-facilitated transport has been recognized as the primary cause of Pu downgradient migration at this site,(4) the stability of Pu on these colloids has yet to be determined, limiting the conceptual understanding of the long-term migration potential of Pu at the NNSS.
It is interesting to note the energy value of this 2.8 metric tons of plutonium is, were it subjected to fission in a nuclear reactor.
It can be shown, by appeal to databases, for example at the Brookhaven National Laboratory, that the fission of a single atom of plutonium-239 yields about 199 MeV of energy, ignoring neutrinos which represent energy which is not recoverable. With some simple calculations, this translates to about 80.3 trillion joules per kg of plutonium. Thus the energy associated with the plutonium melted into glass at the Nevada National (In)security Site is about 0.22 exajoules of energy, or about, roughly 0.2% of all the energy consumed in the United States each year, that being roughly 107 exajoules per year, last time I looked.
In other terms, familiar to old people like me, it is equivalent to about 37 million barrels of oil, or about 1.9 billion gallons. (For comparison, the Exxon Valdez oil spill which destroyed for a time, much of the ecosystem of Prince William Sound, spilled about 260,000 barrels of oil.) The Deepwater Horizon Oil Spill in 2010 amounted to 4.9 million barrels of crude oil. I use these oil/gasoline equivalents to make clear how this might look as an uncontrolled oil or gasoline spill. Of course, more or less, this plutonium is an uncontrolled, albeit deliberate release into the subterranean environment. Thus it is the same situation with crude oil until it is deliberately brought to the surface, where it is literally choking the planetary atmosphere, and for that matter the hydrosphere, to death. Napalm, is of course, gasoline gelled with the addition palmitic acid which is sometimes transformed into the "renewable" diesel fuel biodiesel. As napalm is a weapon of mass destruction which has easily killed more people than Hiroshima and Nakasaki did in the only nuclear war ever observed, it is clear that crude oil and its refined product, gasoline, represent a proliferation risk. Thus the Nevada National (In)security site, might be matched if the US Airforce has bombed the Nellis Airforce Base with so much Napalm as to leave behind 37 million barrels of gasoline unconsumed. When prepared for commercial processes, in dangerous fossil fuel accidents, (that vanish quickly down the memory hole) crude oil and gasoline, of course, spread rapidly when released into the environment, but the question in this post is "how rapidly does plutonium spread?"
Some time ago, I indicated in this space what the bare sphere critical mass of various plutonium isotopes is: Bare Metal Critical Masses of Commonly Available Plutonium Isotopes. (I just edited it to restore broken graphics links.)
Here, for convenience one of the two tables from the paper discussed in that post:
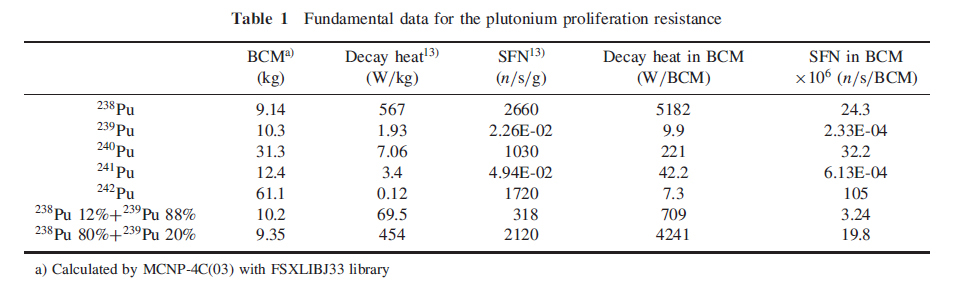
In this table, BCM refers to "Bare (Metal) Critical Mass" and SFN refers to "Spontaneous Fission Neutrons."
Around two billion years ago, because uranium-235 - which has a shorter half life than the dominant uranium isotope, U238 - represented a larger fraction of the mass of uranium ores. In fact, all of the uranium ores on Earth at that time were "SEU," slightly enriched uranium, which is used in many modern nuclear reactors, where only a slight enrichment in necessary in the presence of a moderator, with rare exceptions water, or heavy water, for a reactor to go critical. The evolution of oxygen in the Earth's atmosphere allowed uranium to flow and precipitate in various systems so that at a place called "Oklo" in modern day Gabon, natural nuclear reactors went critical, operating in a cyclical fashion for a few hundred thousand of years. Here is just one of many papers discussing this interesting event:
Fission product retention in the Oklo natural fission reactors (David Curtis, Timothy Benjamin, Alexander Gancarz, Robert Loss, Kevin Rosman, John DeLaeter, James E. Delmore, William J. Maeck, Applied Geochemistry, Volume 4, Issue 1, 1989, Pages 49-62)
Although critical masses are very different for oxides than they are for metals, and very different in the presence or absence of water - the cyclical nature of the Oklo reactors was tied to the fact that the water that moderated neutrons and started the reactors boiled, shutting them down until they cooled enough to resume criticality - one may wonder, naively at least, whether it is possible for similar reactors to form at the Nevada National (In)security Site. This, in turn, will depend on the ability of plutonium to migrate as uranium did billions of years ago.
Don't worry; be happy. (I think it very, very, very, very unlikely.)
In situ plutonium was generated at the natural Oklo reactors just as it is in modern anthropogenic nuclear reactors, whether the reactors are constructed for warlike purposes (where the plutonium production is for the more environmentally impactful weapons grade material which must be synthesized in low concentrations in the fuel) or for saving lives from air pollution in commercial reactors. At Oklo, the evidence is that the plutonium was retained in apatite, a mineral also found in synthetic bone and as a result did not migrate very far: Isotopic evidence for trapped fissiogenic REE and nucleogenic Pu in apatite and Pb evolution at the Oklo natural reactor (Kenji Horie, Hiroshi Hidaka, François Gauthier-Lafaye Geochimica et Cosmochimica Acta, Volume 68, Issue 1, 2004, Pages 115-125).
A fairly sophisticated reactor physics analysis of the Oklo natural reactors may be found here: Criticality of the reaction zone 9 of Oklo reactors revisited (K. Mohamed Cherif, A. Seghour, F.Z. Dehimi, Applied Radiation and Isotopes, Volume 149, 2019, )Pages 165-173)
A similar discussion may be found here: R.T. Ibekwe, C.M. Cooling, A.J. Trainer, M.D. Eaton, Modeling the short-term and long-term behaviour of the Oklo natural nuclear reactor phenomenon, Progress in Nuclear Energy, Volume 118, 2020.
Weapons grade plutonium is mostly 239Pu, and generally has less than 5% 240Pu as I understand it, but during a nuclear explosion, in which a very high neutron flux is observed, because not every plutonium atom fissions when struck by a neutron - some are absorbed according to an important parameter in nuclear engineering, the capture to fission ratio – some of the 239Pu in a nuclear explosion is converted into 240Pu, which is more radioactive than 239Pu because it has a shorter half-life.
Many discussions of radioactivity use the unit "Bequerel," named after the discoverer of radioactivity, Henri Bequerel, which is often abbreviated Bq (and, more rarely, "Beq" ) ; the Bequerel represents the decay of a single atom. The issue of single atom decays in this post will come up later, when I turn to the Dunning Kruger effect and Strawmen listed in the title of this post. Sometimes one will see a fractional "Bequerel" which should be interpreted by taking the inverse of the number and finding the average number of seconds required before a decay is observed. Another unit of radioactivity is the "Curie," usually abbrevieated "Ci." Historically it was taken as the number of decays observed per second in 1 gram of radium. It has been updated to mean 3.7 X 10^(10) Beq, 37 billion decays per second, exactly.
Thus knowing the mass of plutonium in some setting is not sufficient to describe how radioactive it is. For example, here is part of a graphic (part b) from a 1999 paper on the topic of plutonium migration where one of the authors Anie B. Kersting, who is an authority on Plutonium migration and who definitely knows more about the topic than say, Bonnie Raitt (see below):
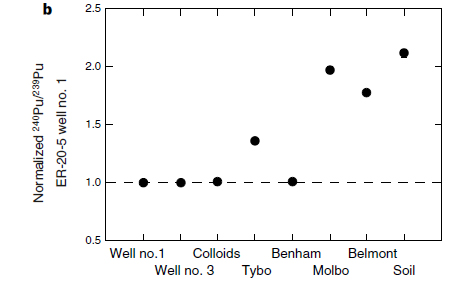
The caption:
Source: Kersting, A., Efurd, D., Finnegan, D. et al. Migration of plutonium in ground water at the Nevada Test Site. Nature 397, 56–59 (1999).
Tybo, Benham, Molbo, and Belmont are all code names for underground nuclear tests conducted by the United States government in Nevada.
Here, from the paper just cited, is a map of where the underground nuclear tests were conducted, as well as some cartoons diagramming the conditions under which the two tests in question were conducted.
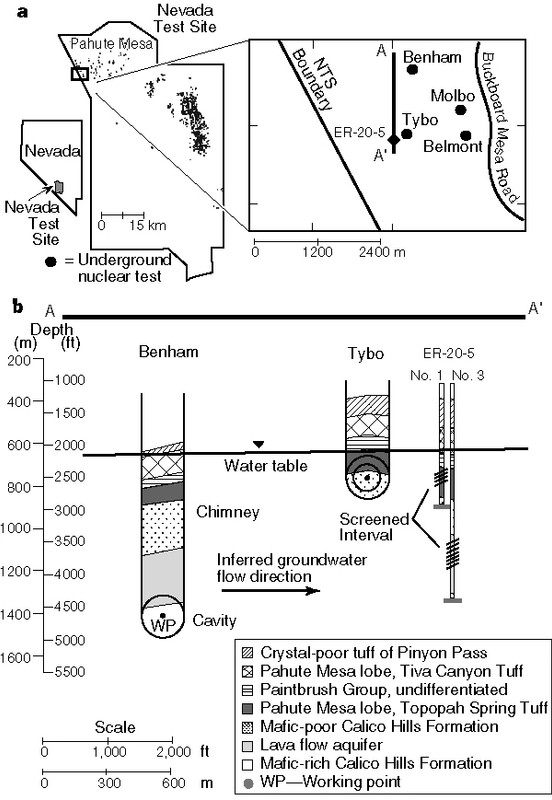
The caption:
We will return below to the measurements reported in this 1999 paper, and compare them with results from other measurements of plutonium in ground water reported in 2020.
Here is a 2002 government report detailing some information about Tybo and Benham, also the topic of Dr. Kersting's 1999 paper: TYBO/BENHAM: Model Analysis of Groundwater Flow and Radionuclide Migration from Underground Nuclear Tests in Southwestern Pahute Mesa, Nevada
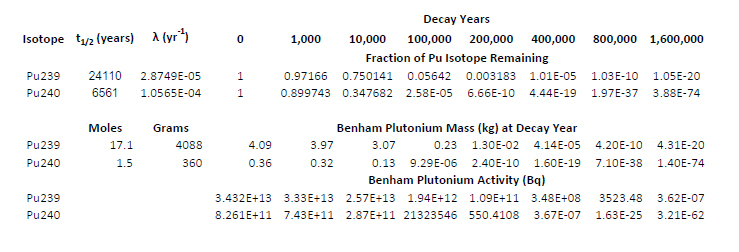
The text indicates that the inventory of residual plutonium in the Benham test is 1.5 moles of Pu240 and 17.1 moles of Pu239 in the glasses lining the nuclear test cavities. The molar ratio between the two isotopes is 8% Pu240, and 92% Pu239, where as the percentage of the observed radioactive decays for the two isotopes is 24% from Pu-240 and 76% from Pu-239. It is very difficult to imagine that the technology exists to isolate this residual plutonium from the Nevada National (In)security Site, but were it possible to do so, and were the composition of plutonium similar to that of the Benham test, it would be less than ideal for use in a nuclear weapon, workable perhaps, but very difficult to assemble because of the high neutron flux from Pu240 spontaneous fission.
This is a reason, by the way, why isolation of plutonium for the assembly of nuclear weapons involves the production of considerably more so called "nuclear waste" than is the case for the reprocessing commercial used nuclear fuels: To prevent the accumulation of Pu240, which tends to make nuclear weapons "fizzle" the fuel rods from the nuclear reactor must be removed after short irradiation times, when the plutonium in the fuel rods is still very dilute, and therefore more problematic to isolate.
I will now turn to a paper Dr. Kersting wrote (as the sole author) surveying migration of plutonium at several major sites where it is not in an engineered environment, that is, where it represents an environmental contaminant located without consideration of long term exposure. That paper is here: Plutonium Transport in the Environment (Annie B. Kersting, Inorganic Chemistry 2013 52 (7), 3533-3546)
Before turning to some of the graphics in the paper, it is useful to take a look at the degree of contamination at each of four nuclear weapons production sites discussed in the paper. (I emphasize that these are weapons sites, because, being poorly educated, unable to make distinctions, ignorant of historical context, indifferent to the observed - and growing death toll resulting from not using using nuclear power more broadly - anti-nukes love to call up reference to say, Hanford, and point to it, as if it is relevant to my position on nuclear power, sometimes with truly awesome levels of stupidity and selective attention: See below.) The weapons production sites, besides the aforementioned Hanford site and the Nevada National (In)security Site, are the Rocky Flats Site in Colorado, and the Soviet Era Mayak Site in the Modern Day Russian Federation.
To wit:
The Nevada National (In)security Site:
The former NTS, currently called the Nevada National Security Site, was the location of 828 underground and 100 atmospheric nuclear tests conducted between 1956 and 1992 as part of the U.S. nuclear testing program.(94) Approximately 4.8 × 10¹⁸ Bq (1.3 × 10⁸ Ci, decay corrected to 1992) of radioactivity remains in the subsurface, consisting of fission products, activation products, actinides, and tritium.(94, 95) Approximately 3.1 × 10¹⁶ Bq (8.3 × 10⁵ Ci) of radioactivity comes from Pu.(94) Greater than 95% of the residual Pu and other refractory radionuclides are sequestered in the melt glass that coalesces at the bottom of the cavity.(96, 40) As the glass alters, radionuclides are released and are potentially available for transport. For more information on the phenomenology of underground nuclear tests, see work by Kersting and Zavarin and references cited therein.(40)
The NTS is located in an arid desert environment with the majority of the nuclear tests detonated in alluvium or rhyolitic volcanic rock. Approximately one-third of the underground nuclear tests were detonated below the groundwater table, in rhyolitic tuff. The groundwater is deep, roughly more than 250 m bgs, and is predominantly sodium bicarbonate, low ionic strength, and low organic carbon with a pH of ?8.(97, 98) In the regions where groundwater flows through fractured volcanic rock, flow rates have been measured up to 80 m/year, whereas in the alluvial basins, groundwater flow rates are much slower, as low as 0.3 m/year.(99)
Rocky Flats:
Rocky Flats is located in the semiarid grasslands on the high plains of Colorado at the eastern edge of the Rocky Mountains. There are two distinct groundwater regimes at Rocky Flats. There is a deep groundwater, about 200–300 m bgs, which is isolated from the shallow groundwater. The shallow groundwater and surface water are inextricably linked because stream channels recharge the shallow groundwater while seeps discharge shallow groundwater to the surface.(102) The shallow groundwater has a pH that ranges between 7.5 and 9.9 and a DOM concentration between 3.6 and 14.0 mg of C/L. Concentrations of Pu in the surface waters ranged from 7.8 × 10^(–3) to 2.2 × 10^(–3 )Bq/L (from 0.21 to 0.06 pCi/L).(23)
The radioactivity described in the surface waters near Rocky Flats is not very impressive, although they surely would excite most anti-nukes into paroxysms of stupidity. 7.8 X10^-3 Bq means that one would need to wait more than two minutes (128 seconds) to observe a single nuclear decay of a single atom of plutonium in the water. One of the more abysmally stupid things that anti-nukes say is that "there is no safe level of radioactivity." This ignores the fact that potassium is an essential element, without which all life, including human life, would not exist on this planet, and that all of the potassium on earth - without extensive and hardly ever practiced laboratory processing - is radioactive, owing to the natural presence of potassium-40, (K-40) which has a half-life of 1.227 billion years. It is also worth noting therefore that when life evolved, potassium was more than twice as radioactive as it is now; life has always been bathed in radiation. A 70 kg human being contains about 140 grams of potassium (cf: Emsley, John, The Elements, 3rd ed., Clarendon Press, Oxford, 1998.) It is straight forward to calculate that the radioactivity associated with this potassium, given the isotopic fraction of K-40 in potassium, and its half-life. It works out to 4,250 Bq per body. Seawater, considering only it's potassium content and not the significant quantities of uranium and uranium decay daughters it contains, is more radioactive than Rocky Flats water, 1.29 X 10^(-2) Beq/liter.
Before being banned at Daily Kos for making a true statement, that statement being - I paraphrase - that "opposing nuclear energy is simply murder," I walked through some related calculations in a "diary" over there to show that the total radioactivity of seawater from potassium alone is about 2 X 10^22 or 530 billion curies: How Radioactive Is the Ocean? In the last 300,000 years, a fair portion of the existence of homo sapiens, the fraction of potassium-40 that has decayed is 0.000163. The sea has always been radioactive and always will be radioactive, and, without ending all life on Earth, nothing can be done about it. Of course, it is something of a quixotic enterprise to explain science to a journalist, in general, and the owner of Daily Kos is just that, a journalist, one on our side perhaps, in terms of supporting and electing Democrats, but completely ignorant of issues in Energy and the Environment.
Mayak:
The Mayak Production Association, located near the southern Ural Mountains in Russia, was built in 1948 to produce Pu for nuclear weapons. It consisted of five nuclear reactors and a reprocessing plant. The Mayak region has been severely contaminated due to both routine and accidental releases of radioactivity.(106) From 1949 to 1956, approximately 106 PBq (2.9 × 10^6 Ci) of nuclear liquid waste was intentionally discharged into the Techa River. Some of the more mobile radionuclides, such as 90Sr, have been detected more than 2000 km downstream.(106)
Starting around 1951, waste effluent was discharged into nearby Lake Karachai. This lake, which has no outlets, was originally an upland marsh with high organic content.(107) It is underlain by fractured andesitic to basaltic metavolcanics. The discharge waste effluents were weakly alkaline NaNO3 brine solutions with a pH between 7.9 and 9.3. Approximately 4440 PBq (1.2 × 10^8 Ci) of nuclear waste effluent containing 90Sr, 137Cs, 239Pu, and 241Am was discharged into Lake Karachai.(106) Concentrations of Pu in the waste effluent at Lake Karachai were approximately 1000 Bq/L (2.7 × 10^4 pCi/L). The Pu concentrations measured in groundwater collected from downgradient wells were 4.8 Bq/L at 0.5 km and 0.029 Bq/L (7.8 × 10^(–1) pCi/L) at 4.0 km distance.(25)
Novikov and co-workers showed that greater than 90% of the Pu detected 4 km from Lake Karachai was associated with the colloidal fraction of groundwater. They were also able to show that the Pu was associated with iron oxyhydroxide colloids. Particle-size analysis of these colloids demonstrated that between 70 and 90% of the Pu detected in the colloidal fraction was associated with the smallest size 3–10 kD filter (?1–15 nm). In the near field, the concentration of Pu both at Lake Karachai and in groundwater samples from the nearest wells exceeds the solubility of PuO2+x (s,hyd), favoring the formation of intrinsic Pu colloids. Understanding the processes controlling Pu transport from complex initial source chemistry to more than 4 km downgradient has yet to be fully determined
 108) nevertheless, it is clear that the extraordinarily high levels of radioactivity released over a period of decades has resulted in one of the most contaminated environmental sites in the world. Within this environment, Pu along with other radionuclides has been transported with inorganic iron colloids significant distances through the fractured metavolcanic subsurface geology.
Hanford:
The Hanford Site was established in 1943 as part of the U.S. weapons program to produce Pu for nuclear weapons. Located in the semiarid, south-central Washington State, the Hanford Site is located on a sequence of unconsolidated fluvial and lacustrine deposits (sand, gravel, and silt) approximately 30–122 m thick. The sediments overlie the Columbia River basalt, and the water table is variable but estimated between 230 and 270 m bgs in the central areas.(109)
The Hanford Site produced about 67 t of Pu for use in nuclear weapons and was the site of the first (sic) nuclear reactor.(110) Separating Pu produced from the reactors and reprocessing the waste resulted in the discharge of large quantities of Pu and other actinides to the shallow subsurface.(111) Releases of radionuclides and hazardous chemicals occurred in a variety of different forms: solid waste in unlined and lined trenches, liquid waste in shallowly buried tanks, and accidental surface releases. The chemical composition of the waste was highly variable with extremes in the pH, salinity, radionuclide composition, and concentration. Approximately 2.4 × 10^8–0.8 × 10^8 GBq (6.5 × 10⁶–0.22 × 10^6 Ci) of high-level waste was discharged to the vadose zone from planned and unplanned releases and leaking tanks, and of this, approximately 4.4 × 10^(5) GBq (1.2 × 10^4 Ci) of 239Pu was disposed of as liquid waste in the near surface.(111, 112) Pu was discharged to the shallow subsurface in over 80 separate locations, although the vast majority of the transuranics was disposed of in the central plateau (200 Area).
It is useful to translate the units of radioactivity used here, GBq (Gigabequerel) into mass. (Note that almost all of the plutonium at Hanford is, in fact, weapons grade plutonium, since that was what the site was constructed to make.) Using the standard nuclear decay formulae, which should be familiar to a good high school student, one can show that the specific activity of plutonium-239 is 2.29 X 10^(12) Beq/kg, or 2.29 TBq (Terabequerel/kg.) If follows that there is about 192 kg of weapons grade plutonium spread around the Hanford site in various places.
An important point at Hanford and Mayak, as opposed to Rocky Flats, to be discussed immediately below, and the Nevada National (In)security Site is that at the two former sites, the chemical form of the plutonium is varied, in some cases acidic, which can change the mobility.
A fairly comprehensive report on plutonium, americium, and neptunium contamination at Hanford is referenced by Dr. Kersting, a report, PNNL-18640, (Cantrell, 2009) which is available for free on line. A unit utilized in the report in many places is the pCi, the "picoCurie," which is equal to 0.037 Bq, implying that to observe one pCi, on average, one must wait a little under 30 seconds to observe the decay of a single atom. The report. A cubic meter of seawater will on average contain about 350,000 pCi of potassium-40. The conclusions of the report include the following remarks:
The primary reason that disposal of these large quantities of transuranic radionuclides directly to the vadose zone at the Hanford Site has not resulted in widespread groundwater contamination is that under the typical oxidizing and neutral to slightly alkaline pH conditions of the Hanford vadose zone, transuranic radionuclides (plutonium and americium in particular) have a very low solubility and high affinity for surface adsorption to mineral surfaces common within the Hanford vadose zone. Other important factors are the fact that the vadose zone is typically very thick (hundreds of feet) and the net infiltration rate is very low due to the desert climate.
In some cases where transuranic radionuclides have been co-disposed with acidic liquid waste, transport through the vadose zone for considerable distances has occurred. For example, at the 216-Z-9 Crib, plutonium-239 and americium-241 have moved to depths in excess of 36 m (118 ft) bgs. Acidic conditions and the presence of possible complexants could increase the solubility of these contaminants and reduce adsorption to mineral surfaces. Subsequent neutralization of the acidity by naturally occurring calcite in the vadose zone (particularly in the Cold Creek unit) appears to have effectively stopped further migration.
Anyway.
Often, when people come to me to display their intellectual laziness and/or ignorance by complaining about so called "nuclear waste," they often pull arbitrary numbers out of their hat about "how long" it's supposed to stay "dangerous." One hears numbers like "billions of years" (which is how long potassium and uranium and thorium all of which were on the planet when it formed are radioactive), or "millions of years" and sometimes "thousands of years," as if the carbon dioxide, mercury, and lead from dangerous fossil fuels disappear in minutes, even though their environmental lifetimes are essentially eternal.
In connection with the 2.8 tons of plutonium at the Nevada National (In)security Site it is useful for the purposes of this "too long to read" post what the decay timelines for the plutonium will be at the site.
In the Inorganic Chemistry 2013 paper, Dr. Kersting provides a kind of graphic one sees in many contexts connected with the management of so called "nuclear waste," a comparison between radiotoxicity (by various means of biological transport) associated with the constituents of used nuclear fuels (or in this case weapons manufacture and/or nuclear testing) in comparison with that associated with natural uranium ores. It is important to note however, since Dr. Kersting is a geochemist concerned with the behavior of actinides and fission products in the environment, specifically in geological structures, she is primarily concerned with buried plutonium. Here it is:
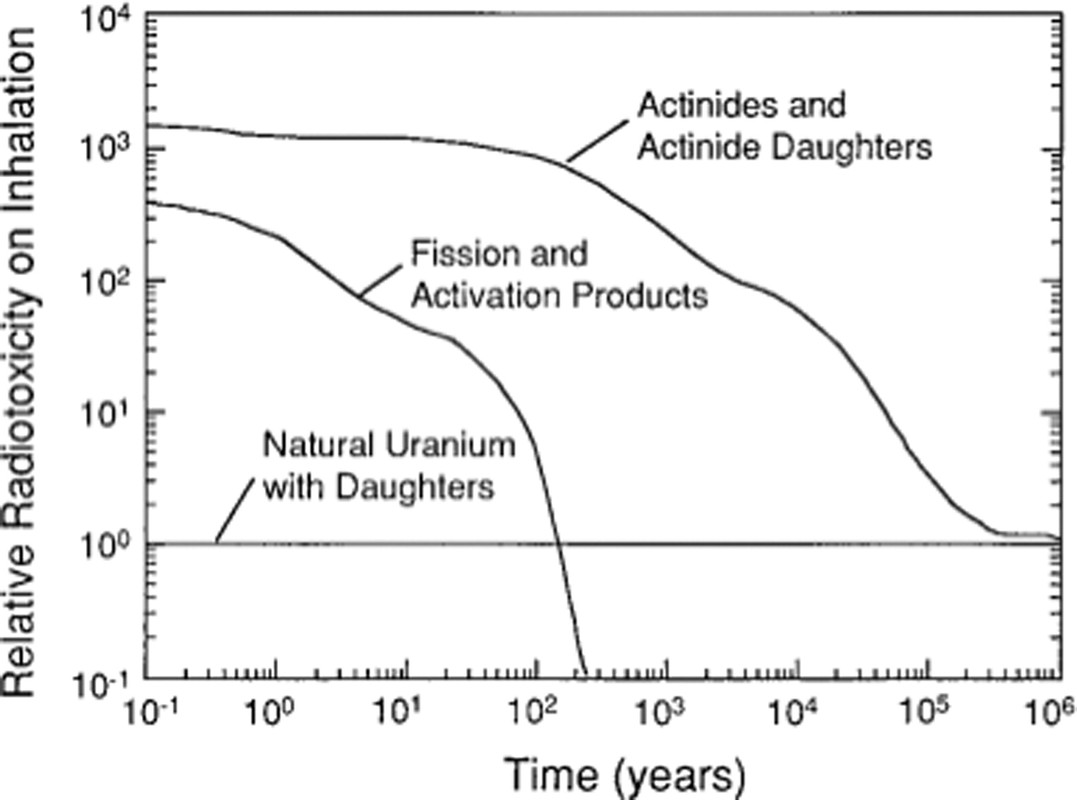
The caption:
This graphic is reproduced from an original document here: Nuclear waste forms for actinides (Ewing, PNAS March 30, 1999 96 (7) 3432-3439)
Of course, the only "waste form" at the Nevada National (In)security Site, is glass formed from the heat of the explosion of a nuclear weapon underground. Below we'll consider how mobile this plutonium is. However, it is next to impossible to directly recover it in any way.
Using simple nuclear decay laws, the atomic weights of the two isotopes and the data discussed above for just one of the 828 underground nuclear explosions in Nevada, the Benham explosion, I have prepared the following table.
Although anti-nukes are prone to deny it, because they are most often discussing topics about which they know nothing, however, the situation is very different at weapons sites as opposed to commercial nuclear reprocessing sites. The recovery of the transuranium actinides using a wide variety of processes is well understood, and all of them, not just plutonium but also neptunium, americium, and curium are potential nuclear fuels. I therefore always argue that it is just stupid to bury them, as they are vital resources in a time of climate change and massive rising air pollution death rates.
The following figure shows the very different case obtained if one separates the uranium, plutonium and minor actinides (neptunium, americium and curium) and fissions them, whereupon the reduction of radioactivity to a level that is actually below that of the original uranium in a little over 300 years:
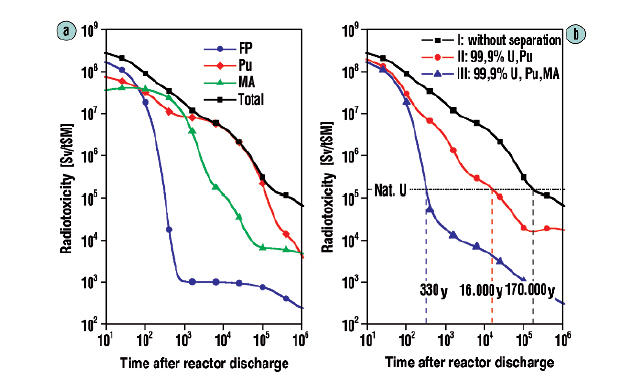
The caption:
(Hartwig Freiesleben, The European Physical Journal Conferences · June 2013)
Source 17, in German, is this one: Reduzierung der Radiotoxizität abgebrannter Kernbrennstoffe durch Abtrennung und Transmutation von Actiniden: Partitioning. Reducing spent nuclear fuel radiotoxicity by actinide separation and transmutation: partitioning.
It is important to note that simply because a material is radioactive does not imply that it is not useful, perhaps even capable of accomplishing tasks that nothing else can do as well or as sustainably. Given the level of chemical pollution of the air, water and land, in fact, the use of radiation, in particular high energy radiation, gamma rays, x-rays, and ultra UV radiation may prove to be more important than ever, but that's a topic for another time.
To return to the topic at hand, plutonium - which I regard as an essential element for a sustainable world - plutonium dioxide, plutonium form found very commonly in the environment, is an extremely insoluble compound. The concentration of plutonium in water over the oxide has been calculated to be 3 X 10^(-17) M. (cf. Haschke, Thermodynamics of water sorption on PuO2: Consequences for oxide storage and solubility (Journal of Nuclear Materials, Volume 344, Issues 1–3, 1 September 2005, Pages 8-12) One can back calculate what this represents in terms of radioactive decay, in units of Bq, again using the mass of 239Pu, the decay constant and Avagadro's number to see that this represents 1.65 X 10^(-5) Bq, meaning that if one were observing a liter of water saturated with PuO2, one would need to wait nearly 17 hours on average to observe even a single atom of plutonium decaying in the saturated water. This is way less radioactive than the natural radioactivity of seawater or, for that matter, human flesh.
But perhaps I'm being a little too glib here, since the paper cited at the outset of this post, co-authored by Dr. Kersting, who is way smarter than I am, contains the word migration, does it not?
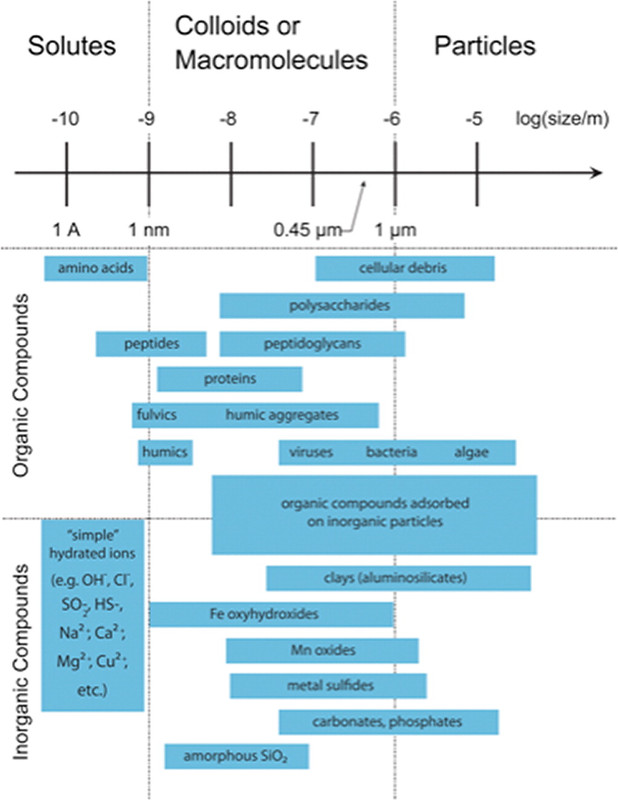
It turns out that there are other mechanisms for the transport of plutonium, and Dr. Kersting summarizes them quite well in her 2013 Inorganic Chemistry paper. The mechanism is transport on colloids. It is therefore useful to look a some pictures from Dr. Kersting's 2013 paper beyond that posted above:
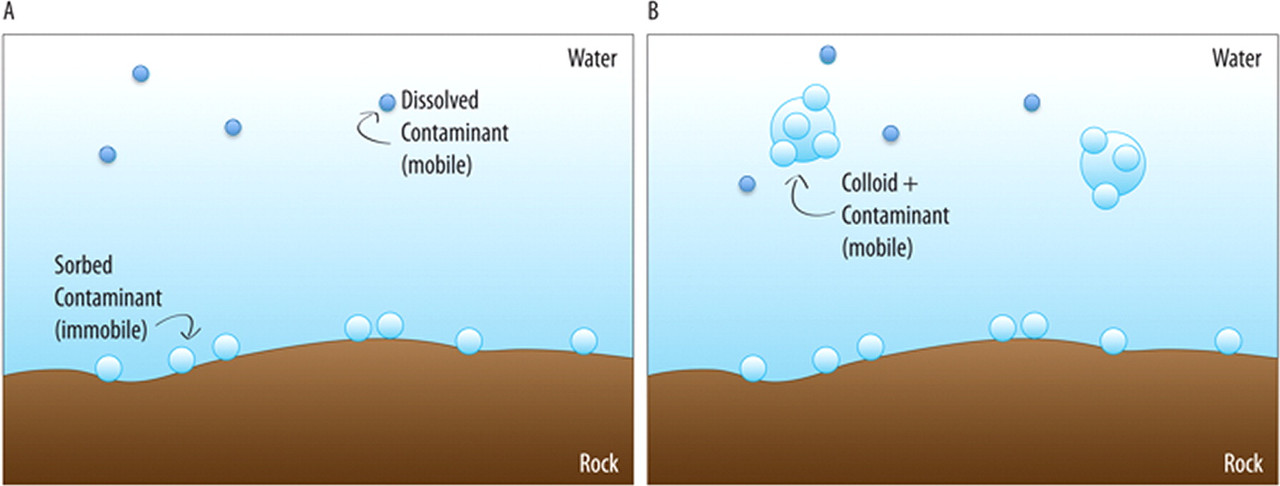
The caption:
The caption:
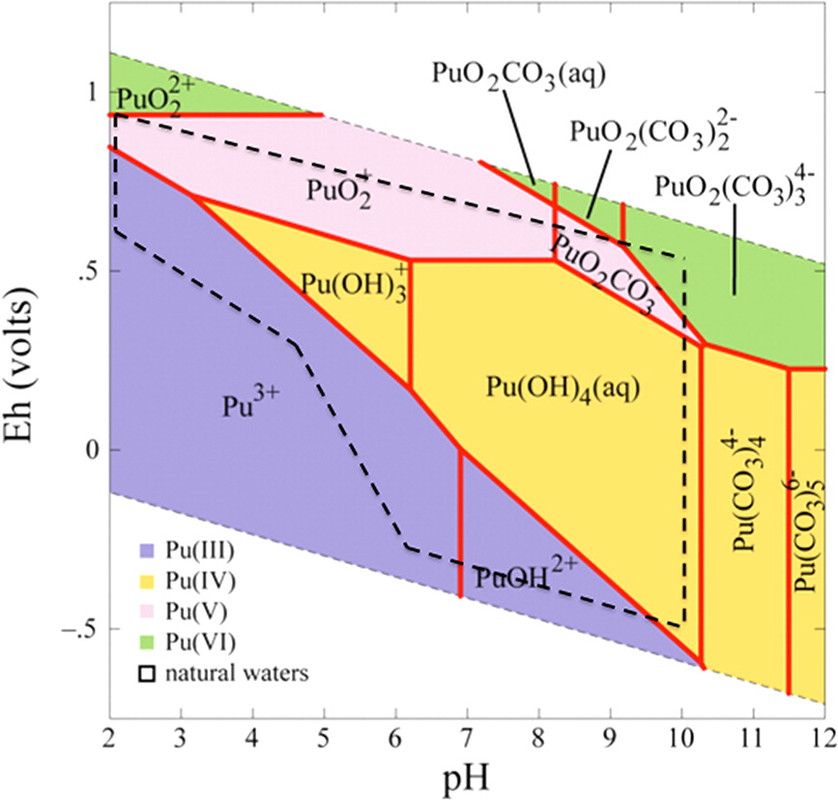
The caption:
Another term for "Eh–pH diagram" is "Pourbaix diagram." This Pourbaix diagram reflects the very complex and extremely interesting redox chemistry of plutonium. Even were it not an element that will surely prove critical to saving humanity from itself, assuming that humanity does save itself, plutonium would be, and is, of extreme academic interest, being one of the very rare metals that can simultaneously exist at equilibrium in three oxidation states simultaneously. Just as the presence of oxygen in the planetary atmosphere plays a role in the fact that the oceans contain approximately 4.5 billion tons of uranium in equilibrium with the planetary mantle - the evolution of oxygen accounts for the events at Oklo - the varied oxidation states of plutonium can play a role in its solubility, at least under some circumstances, for example transport to colloid particles, although it's not clear that this is, in fact, how plutonium bearing colloids are formed.
More about the colloids:
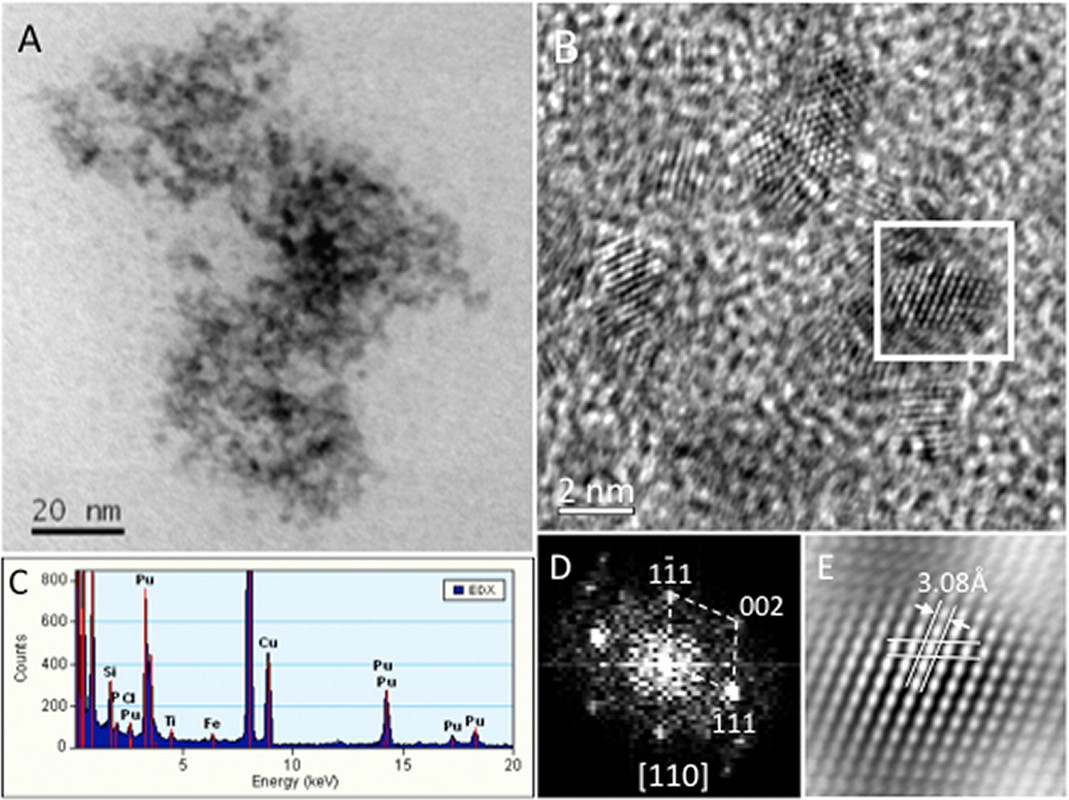
The caption:
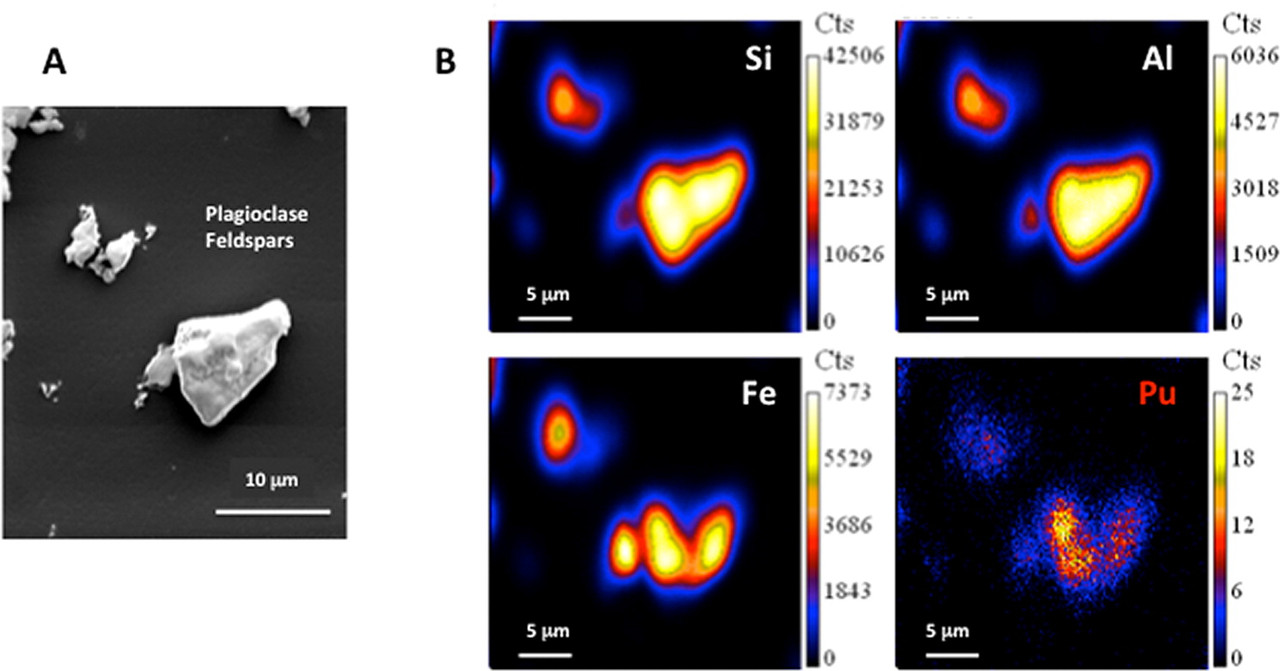
A real life plutonium bearing colloid from the Hanford site:
The caption:
Now I would like to return to the paper cited at the very outset of this long diatribe, to wit: Kersting et al., Environmental Science & Technology 2019 53 (21), 12238-12246.
In this paper, the authors took colloids formed using real melt glass, retrieved from real underground nuclear tests and stored at Lawrence Livermore National Laboratory, and prepared colloidal minerals (Montmorillonite Sw-y) which make up clay, to understand their ability to transport plutonium. Since, as described in the excerpt at the beginning of this dreary post, some of the nuclear test caverns remain thermally hot, and others are cool, the extraction was performed under conditions designed to mimic the range of these observed conditions. Then they set out to see how well the plutonium transported on colloids was subject to release.
The preparations of the colloids is described in a previous paper by Dr. Kersting and her coauthors, this one: Hydrothermal Alteration of Nuclear Melt Glass, Colloid Formation, and Plutonium Mobilization at the Nevada National Security Site, U.S.A. (Mavrik Zavarin, Pihong Zhao, Claudia Joseph, James D. Begg, Mark A. Boggs, Zurong Dai, and Annie B. Kersting, Environmental Science & Technology 2019 53 (13), 7363-7370) In order to transfer plutonium from the melt glass to the colloids, the experiments were conducted over a number of years, and measured the concentration of two fission products, Eu-152 and Cs-137, plutonium (239+240), and an activation product, Co-60, presumably formed by neutron capture in the iron of the steel casings of the test bombs.
The purpose of the paper cited at the outset of this unreadably long post is described by the authors at the end of the introduction, including some comments on the nature of the samples:
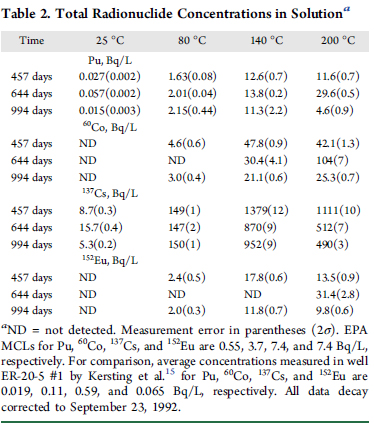
The authors then processed the colloids formed over a period of years as described in their earlier paper, and allowed water to flow over these colloids to see how much plutonium (and cesium) was released into in the process:
The conditions under which the desorption tests were conducted are shown in two tables from that paper
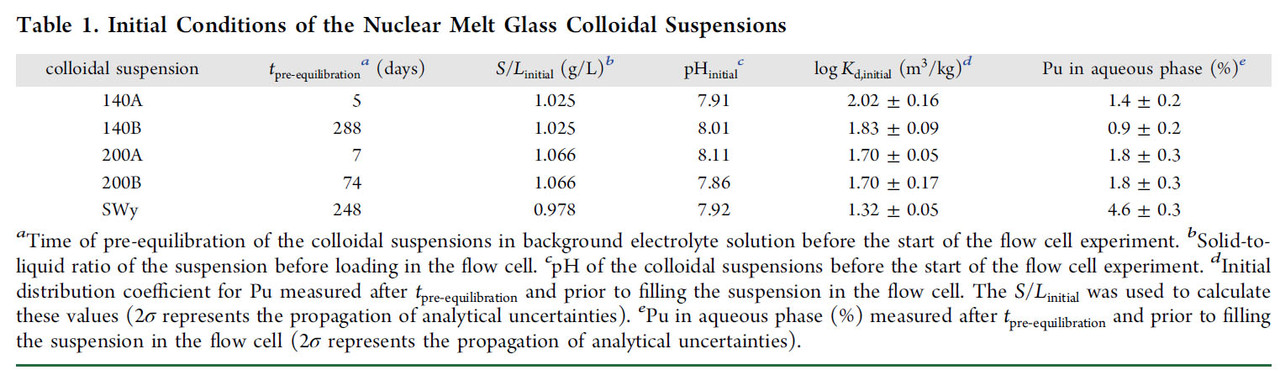
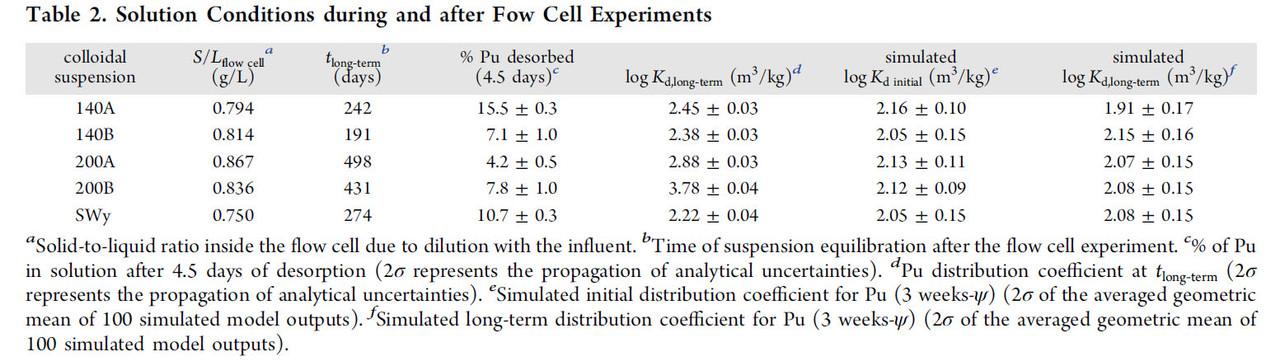
The "percent talk" in table 1 - which is often used misleadingly by advocates of so called "renewable energy" to conceal its failure to address climate change - looks rather frightening until one looks at absolute numbers, displayed by figure 1 from the paper:
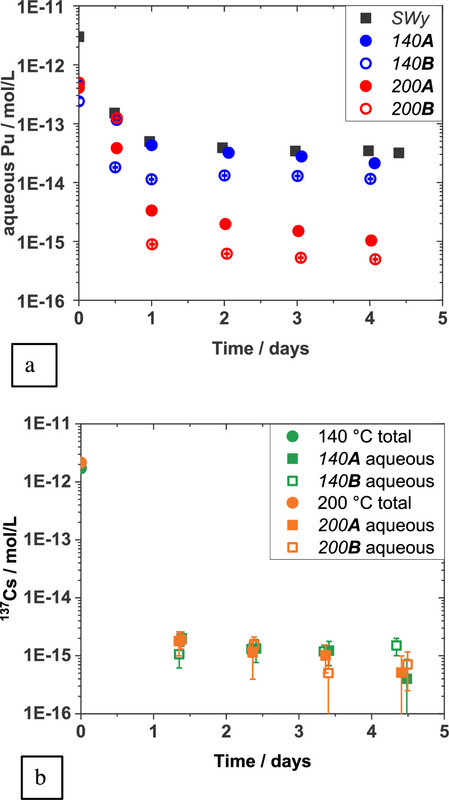
The caption:
It is useful to convert the "molar" figure into Bq, using the specific activities (calculated from the decay constant in inverse seconds, not inverse years) of the two plutonium isotopes, 239 and 240 which, according to the graphic from Dr. Kerstings 1999 Nature paper, shown above, is approximately 1:1 for the Benham and Tybo nuclear weapons tests. One can calculate that the activity of Pu-240 at 2.5 X 10^(-13) M is about 0.1 Bq for Pu-239, and about 0.5 Bq for Pu-240; carrying through some non-significant figures, it works out to one nuclear decay every 7 seconds in the former case, 1 decay every 2 seconds for the latter case.
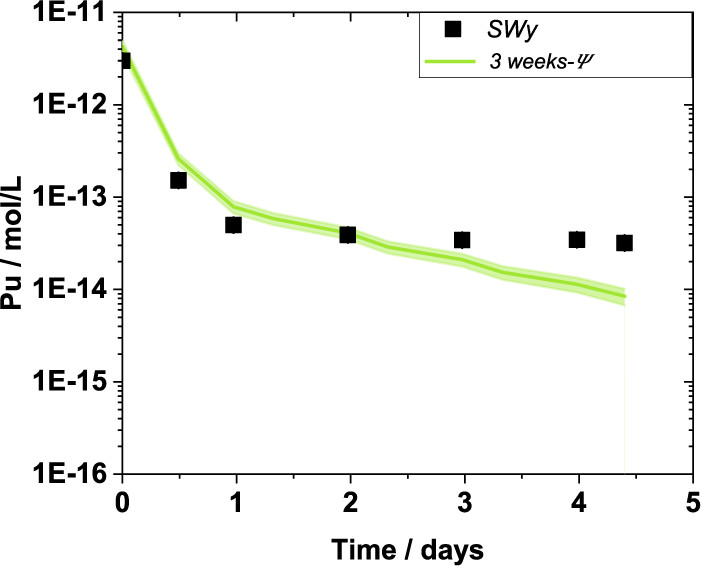
Two other related graphics from the paper:
The caption:
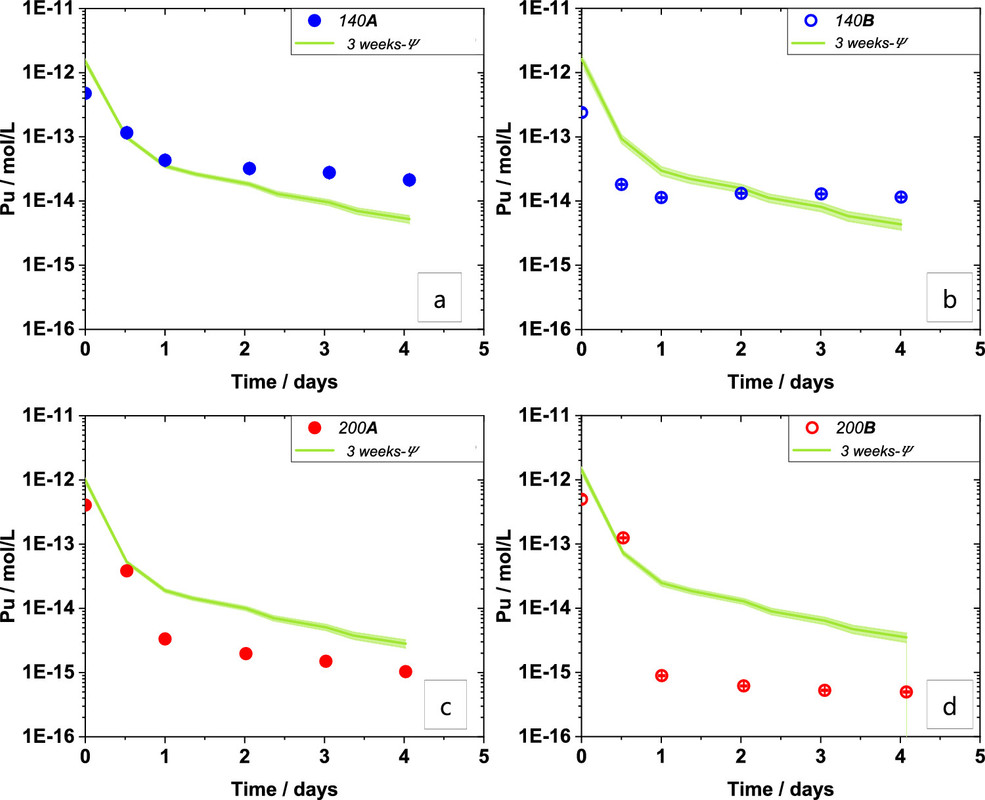
The caption:
Note that these papers refer to laboratory evaluations, and not to real world situations.
It is nevertheless interesting to compare the values herein with the EPA standards for drinking water, which for gross alpha contamination is 15 pCi/liter, which translates to 0.56 Beq/liter. It is important to ascertain what this standard means. It does not mean that if one drinks water exceeding this limit that one will immediately die, although in long experience in dealing with the mentality of anti-nukes, it would not surprise me to learn that people might so interpret it as such. If this were the case, people would be dropping like flies all over the United States.
Let's consider some real world situations. I live on the Reading Prong, a natural uranium formation, that produced a gasp of terror in the New York Times shortly before Chernobyl blew up, where the uranium is in secular equilibrium with its daughter elements, including radium-226. I have measurable Radon-222, the gaseous daughter of Ra-226 in my home on the lower level, happily below EPA recommended levels, although I have never checked my well water for Ra-226. The EPA guidance on drinking water specifically refers to this isotope, Ra-226. The EPA guidance is not a function of instantaneous death should one exceed it, rather is a function of the PDE (permissible daily exposure) and MDD (Maximum Daily Dose) and assumes that one is drinking water, and the exposure limit is very conservative 4 mrem/year. For perspective, a three hour ride in a commercial airliner exposes one to 1 mrem. I just had a CAT scan to evaluate some abdominal pain - happily it does not seem to involve cancer - and was exposed to about 2,000 mRem. Of course, the conservative drinking water standard is connected to ingested radionuclides which is different than whole body exposure, but again, we all experience internal radiation because our lives depend on having potassium in our bodies and all of the potassium on Earth is radioactive; this natural radiation amounts to about 33 mRem/year.
Following Dr. Kersting's papers on plutonium migration, the Lawrence Livimore National Laboratory published a broader survey of water at the Nevada National (In)security Site: Interpretation of Mineralogical Diagenesis for Assessment of Radionuclide Transport at Pahute Mesa, Nevada National Security Site It is open sourced; anyone can read it. (Dr. Kersting's papers are referenced in this report.) Nevertheless, for convenience I reproduce Figure 6 from the paper which compares the concentration of plutonium in test wells near nuclear test sites with the EPA gross alpha standard:
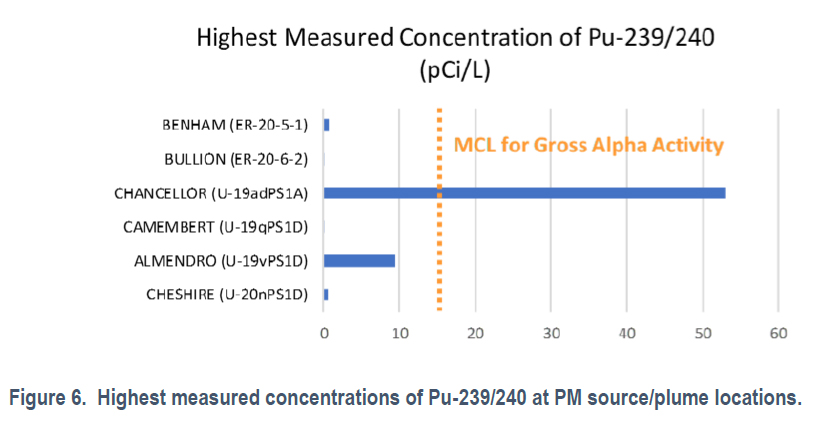
It appears that only one test well exceeds the EPA limits for drinking water, which is not to say that I recommend drinking well water from the Nevada National (In)security Site, on the other hand if one did, this data suggests the result would not be fatal.
Speaking of the "real world," while we all wait breathlessly for the grand so called "renewable energy" nirvana which has not come, is not here, and frankly, won't come, we are drilling the shit out of the North American continent, shattering rocks beneath it forever far beyond the Nevada National (In)security Site to get the last drops of oil and gas out them. The purpose of shattering the shit out of rocks, is of course, to increase their surface area. The Marcellus shale, near where I live, contains besides oil and gas, large amounts of uranium and its daughters, including radium-226 and radon-222. The rocks are shattered using high pressure water, and it happens that water extracts radium-226 and brings it to the surface in a solution of nasty things known as "flowback water," where it is dumped in a largely unregulated fashion.
A great deal has been published on the "NORM" (Naturally Occurring Radioactive Materials) in flowback water, and it is illuminating to compare the radiation levels associated with plutonium resulting from nuclear tests at the Nevada National (In)security Site with flowback water. For one example of such measurements, radiation in flowback water - there are oodles of them available for any interested party - consider this paper: Estimating Radium Activity in Shale Gas Produced Brine (Wenjia Fan, Kim F. Hayes, and Brian R. Ellis Environmental Science & Technology 2018 52 (18), 10839-10847. Three fracking sites are compared, one on the Marcellus Shale in PA, near where I live, and two in Michigan.
A graphic from that paper:
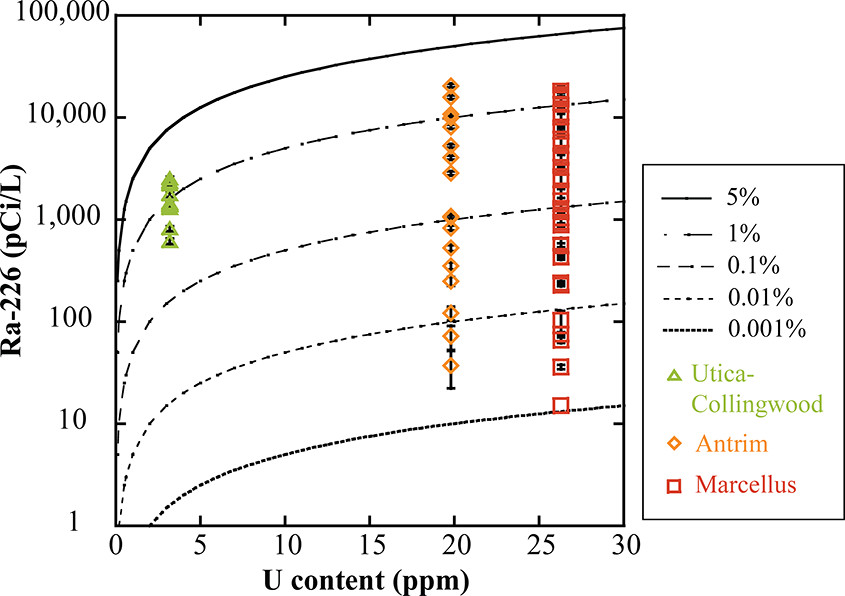
The caption:
There you have it. Samples of "flowback water" dumped on the surface in Michigan and In Pennsylvania are (with a few exceptions in this graphic) are more radioactive than samples of water obtained from test wells near the sites of historical nuclear weapons tests at the Nevada National (In)security Site. After a long life, I am certainly cynical enough to understand that the very same people who wait endlessly for the so called "renewable energy" nirvana that did not come, is not here and will not come, while we frack gas and dump the waste directly in the air or on the land (in flowback water retention ponds) will carry on endlessly about say, Fukushima while not giving a rat's ass about radium in Michigan and radium in PA that has been brought to the surface because so called "renewable energy" depends on continuous access to dangerous natural gas.
As I often say, "History will not forgive us, nor should it."
Much of what I've written about radiation above with respect to radiation exposure consists of something called "facts." Some of these facts have been well know for a very long time, for example about background radiation exposure, but over the last half a century, I've heard a great number of what can only be called "conspiracy theories" about radiation exposure that center around the premise, often spouted by anti-nukes, that there is "no safe level of radioactivity" despite the obvious statement, connected with potassium that there is no safe level of not having radioactivity exposure since potassium is an essential element for all living things.
Let me move away from physical science to a quasi "social science" discussion.
Back in 2018 I had the pleasure of attending a lecture that can now be viewed on line at the Princeton Plasma Physics Lab website. One of the slides on the big screen was a picture of Donald Trump. Here is a link to the place where the lecture can be viewed: Science on Saturday: Improbable Research and the Ig Nobel Prizes.
One of the featured Ig Nobel Prizes discussed in the lecture was the now somewhat famous "Dunning Kruger Effect," for which an Ig Nobel was awarded in 2000. The Dunning Kruger Effect is based on a study which concluded that people who are incompetent to comprehend a subject are incompetent to know that they are incompetent. The Science on Saturday lectures take place in New Jersey, a very reliable blue state, and when discussing the award to Dunning and Kruger - which the speaker indicated is actually awarded to stimulate thinking - the speaker flashed a big picture, with an appropriate deadpan pause, of Donald Trump, who at that point occupied the White House, with the result of a loud round of laughter from the audience.
Of course, Donald Trump, the very stable genius, is famous for making endless statements about multiple subjects that begins with the words, "Nobody knows more about..." [insert subject] "...than I do," where all of the subjects he named are subjects about which he knows very little, or, in fact, nothing at all. There are videos on the internet which consist entirely of chains of these statements; if you can tolerate hearing anything at all from this sad excuse for a human being you can Google your way to videos of tandem statements by this fool referring to various subjects.
You can also Google your way to lots of lectures by and interviews of the psychologist David Dunning describing the effect. One of the points he makes is that the effect is not limited to Donald Trump, although Donald Trump may be regarded as a kind of reification of the effect, but we all over estimate ourselves in certain areas. For example, something like 88% of people estimate that their own driving skills are in the 25th highest percentile.
One path to over-estimating oneself is to assume that someone who speaks or writes on a particular subject with an air, that is, an affectation, of authority is, in fact, an authority, and thus, falling uncritically into this assumption, end up parroting that person’s views as one's own. This is an example of the famous logical fallacies of appeal to authority and appeal to false authority.
If of course, one knows nothing at all about a subject, and encounters someone who claims to do so, irrespective of their actual knowledge of the subject, it is quite possible, particularly if one is credulous, to believe whatever that person says, particularly if they enjoy some measure of fame for their position.
I certainly have some experience with being credulous.
I first learned about nuclear power growing up on Long Island, NY, during the controversy surrounding the construction of the Shoreham Nuclear Plant, which, after several billion dollars were spent building it, never provided a watt of power to the grid on Long Island. (It briefly achieved low power criticality.) The local newspaper on Long Island, Newsday, was very hostile to the Shoreham Nuclear Plant, as well as to the company that was building it, LILCO, the (now defunct) Long Island Lighting Company. Another almost local paper that was, and still is, hostile to nuclear energy is of course, the national “paper of record,” The New York Times, which can still hold forth endlessly on Fukushima and Chernobyl but never to my knowledge, gives any consideration at all to the 18,000 to 19,000 people who died yesterday, and the additional 19,000 who are dying again today, and the additional 19,000 who will again die tomorrow, all dying, day to day to day to day from air pollution, 19,000 being, by the way, is more people than will have died yesterday, today, and will die tomorrow, from Covid-19.
It is interesting to note that parts of Long Island, notably its south shore area, are prone to being submerged as a result climate change, a topic never discussed by the journalists who carried on endlessly about evacuating Long Island as a result of a putative melt down of the plant. In fact, parts of the South Shore were submerged during hurricane Sandy. (The Shoreham nuclear plant was built on a bluff on the North Shore of the Island.) During the storm, a relative of mine on Long Island had to move his entire family to the attic of their home, where they all hunkered down while water came through the floor boards, but thankfully the water subsided before they all drowned.
Now, well into a long scientific career, and having, post-Chernobyl, having undertaken a fairly exhaustive study of nuclear technology in the primary scientific literature, I can and do frequently make the joke that one cannot be awarded a degree in journalism if one has passed a college level science course, but this certainly wasn’t my attitude when I was growing up. I generally believed journalists when they wrote about science, and probably the reason was that I didn’t know very much science. (Neither of my parents graduated from high school; one didn’t graduate from junior high school.) I actually thought journalists knew something about science.
In my late teens and early 20s, as I rebelled against my parents political conservatism in such a way as to assume that if a topic or belief was commonly and widely held by political liberals, as I a nouveau political liberal, I was required to regard it as the right - indeed the only - position to take, I was drawn to journalists who wrote with hostility to nuclear energy. As a result, in my 20’s, I certainly was drawn to radical anti-nuclear journalists. An example of such a journalist, which is not to say that I specifically recall reading any of the dangerous and deadly tripe he’s been handing out in a toxic life that has led to the deaths of millions of people from air pollution, would be this guy: Harvey Wasserman.
Speaking of widely held de rigueur beliefs on the left, returning to the happy report that I was banned from a liberal website, Daily Kos, for making a true statement, based on the work of the climate scientist, Jim Hansen, who was very popular as a climate scientist at Daily Kos, until he said something that didn't jive with our dogma, by showing, unequivocally, that opposing nuclear energy kills people. It is not true that everyone on the left accepts science irrespective of politics, but of course, it appears to me that neither Markos Moulitsas or Tim Lange (Meteor Blades on Daily Kos) could have possibly passed a college level science course, since both have degrees in journalism.
Again, and again, and again, "to the last syllable of recorded time:"
Prevented Mortality and Greenhouse Gas Emissions from Historical and Projected Nuclear Power (Pushker A. Kharecha* and James E. Hansen Environ. Sci. Technol., 2013, 47 (9), pp 4889–4895)
Harvey Wasserman, who knows no chemistry, no engineering (electrical or otherwise), nothing at all about the chemistry of semi-conductors, or the chemistry of batteries, who knows no physics, nevertheless felt qualified to write a book on how to save the world, Solartopia! Our Green-Powered Earth, A.D. 2030
It's 2021, nine years before 2030, the magical year Wasserman evoked in 2006. Humanity is now consuming over 600 exajoules of energy per year. Solar energy doesn't produce 5 of them. When the first edition (of which I'm aware) of Solartopia was published in March of 2006, the concentration of the dangerous fossil fuel waste carbon dioxide in the planetary atmosphere was 382.9 ppm. Yesterday, as of this writing February 3, 2021 it was 415.73 ppm (Accessed 02/04/21.) According to the World Health Organization web page, because 2.0 billion people lack access to basic sanitation:
Diarrhoea remains a major killer but is largely preventable. Better water, sanitation, and hygiene could prevent the deaths of 297 000 children aged under 5 years each year.
World Health Organization Fact Sheet
Solartopia indeed. (Bourgeois ethics can be appalling, can they not?)
Harvey Wasserman once put together a huge event in which prominent physicists and physical and semiconductor chemists, Bonnie Raitt, Jackson Brown, Crosby Stills and Nash, and Bruce Springsteen gathered in front of huge piles of electrically powered amplifiers, consuming thousands and thousands of watts, lit by powerful hundreds of thousand watt floodlights, to post equations to a huge screaming audience about "No Nukes."
Don’t worry. Be happy. Nothing to see here. No Nukes!
The famous rock guitarist guitarist and rock singer, Nobel Laureate Glenn Seaborg, chairman of the Atomic Energy Commission during the period when most of the US nuclear reactors were built and came on line, who discovered plutonium, americium, curium, berkelium, and californium, among other elements in the periodic table, and who advised every US President from Truman to Clinton, was not invited to the "No Nukes" concert, even though I'm sure that he could have lectured Bonnie Raitt on how to sing and how to play the slide guitar in a way that everyone would find appropriate, of course.
(For the record, I was a big fan of Bonnie Raitt's music, and when I was playing in clubs as a kid, a fair part of my repertoire, both in folk settings and in electric bands, consisted of interpretations of songs to which I was introduced by her records.)
Harvey Wasserman, impresario extraordinaire of "No Nukes" concerts is described, particularly by other journalists, as an "activist." Is this the same as expert? No, it isn't. He is an "expert" on nuclear energy in the same way as anti-vaccine "activist" former Playboy nude model and "actress" Jenny McCarthy is an expert on vaccines. Indeed, since nuclear energy saves lives that would otherwise be lost to air pollution Wasserman, like McCarthy applies his appalling ignorance to kill people.
Wasserman was born on New Year's Eve, 1945. It's surprising that he's not dead, since nuclear power didn't go away despite his best efforts, and of course, in 2030, if he isn't killed by plutonium atoms, he will be 85 years old. If he is still alive, and he may be, he will be another example of a petulant bourgeois airhead making glib promises about what future generations will do as an excuse for not be able to do what he predicts others will do himself. In 2030, the young men and women who were born in 2000, and who are in their early careers, will be living with fewer available resources, a vastly more damaged environment, and, oh yeah, abandoned solar cells that will have added to the existing intractable vast masses of electronic waste. Every twenty-five years, all of the infrastructure of so called "renewable energy" existing will need to be replaced in addition to any growth these unfortunate systems may experience.
Solartopia.
The actions of "activists" have consequences. In the 15 years since the first publication of Solartopia (which was in 2006 to my knowledge), somewhere between 90 million and 105 million lives were lost to air pollution. This is the equivalent of completely wiping out that so called "renewable energy" nirvana Germany, killing every man, woman and child, and then some. The concentration of the dangerous fossil fuel waste in the planetary atmosphere has risen by almost 33 ppm, or in the "percent talk" of "renewable energy" advocates, by 11.7% of the value in 2006.
Solartopia.
In the year that Harvey Wasserman was born, the very first plutonium based nuclear weapon was detonated in New Mexico, shortly after the first multi-kilogram quantities of the element had been synthesized and isolated from large quantities of uranium.
Nevertheless, Harvey Wasserman is still alive, despite the fact that during his life time, commercial nuclear power has grown from a rather primitive affair in the Manhattan Project era exclusively devoted to war, to a large commercial activity that represents the world's largest infinitely scalable source of carbon dioxide free energy ever developed. I guess, in spite of his massive paranoia, fed by his massive ignorance, nuclear power didn't wipe out the world, or even cause a death toll that approximates, even on a miniscule scale, the death toll associated with air pollution while we all wait, like Godot, through endless failed promises, for Solartopia..
Solartopia.
Above I made this statement: "Harvey Wasserman, who knows no chemistry, no engineering (electrical or otherwise), nothing at all about the chemistry of semi-conductors, or the chemistry of batteries, who knows no physics, nevertheless felt qualified to write a book..."
Given that I find Harvey Wasserman to be a disgusting excuse for a human being, a Jenny McCarthy of energy, is it really possible for me to assert what he does and does not know, given that I would be unwilling to spend more than 50 seconds in a room with him? It is true that when I was participating at Daily Kos, I had occasion to come across some of his writings there, and however far I went to endure them, I certainly can't recall any evidence that he knew any science, but am I being unfair? Is it possible that he, and Markos Moulitsas or Tim Lange have taken science courses and have passed them with a grade of C or better? Maybe. I see no evidence of it, but certainly it is possible. Am I being unfair?
I don't think so. I really don't have to study the knowledge base of Jenny McCarthy, who became an expert on autism, apparently, by being photographed naked in various provocative poses. If I really want to know anything about autism, I could alternatively - and I have actually done this - attend a lecture by Princeton Professor Sam Wang where he discussed the origins of autism, among other subjects.
Fairly or not - and I'm not inclined to be "fair" to either Jenny McCarthy or to Harvey Wasserman nor their many intellectual and moral equivalents - I see anti-vaxxers and anti-nukes as generic. Their beliefs - and they are nothing more than beliefs unconnected with facts - define completely enough who they are. At least to a first approximation, these beliefs also define what they know, to the point there can be no interest in further understanding how or why they came to their toxic, and frankly dangerous, ignorance. It is therefore a waste of time to get to the details of what they do and do not know.
On May 9, 2017, at Hanford one of two tunnels with some rail cars on which some retired chemical reactors utilized for the extraction of weapons grade plutonium from fuel rods collapsed. The tunnels were called the "Purex tunnels" after the PUREX process to isolate plutonium, invented by Nobel Laureate Glenn Seaborg, who never deigned to lecture Bonnie Raitt on how to play slide guitar. They were built in 1955, and were supported by steel and wood beams that severely corroded. A detailed engineering description of the tunnels can be found here: Purex Tunnel One Engineering Evaluation.
Ten days after the collapse the radiation levels in the area were measured. They are here: Sampling Data Purex Tunnels
If one reads through accounts of the response to this event, it becomes very clear that it involved tens of millions of dollars to address. From the radiation levels detected in the area, it's not immediately clear to me that even one life has been saved by the response, because the risk to human life at these levels is almost vanishingly small. It seems fairly obvious to me that if the same amount of money as has been spent on addressing the collapse of Hanford Purex Tunnel #1 had been spent building systems to handle human fecal waste for those who have no means of processing it, many more lives might have been saved than would have been lost if nothing had been done about the collapse of Purex Tunnel #1 beyond pouring concrete over it, if even that were worth it. In the actual event, well paid highly trained engineers, vast construction crews etc, etc expended their talents to solve the "catastrophe" of the tunnel collapse.
I have no idea how many opening posts I've authored at Democratic Underground and other blogs over the last two decades on various scientific subjects. Years ago, I might have recalled writing the bulk of them, but I no longer do. I am old, near the end of my life. It is clear that the overwhelming bulk of my scientific writings have concerned nuclear energy, all built around the oft repeated premise that nuclear energy need not be risk free to be vastly superior to all other options, including the wasteful and failed adventures in so called "renewable energy." The redundant tautological statement I often make is that "the only thing nuclear energy needs to be to be better than everything else is to be better than everything else which it is"
I would have never considered the collapse of Hanford Purex Tunnel #1, were my attention not drawn to it when a correspondent called up one of my old and forgotten posts on nuclear energy to sneer at me about it the "catastrophe" of a collapsed tunnel built in 1955 and largely forgotten. Of course, over the last two decades of blogging, I've seen lots of sneering at my position on nuclear energy, almost all of it abysmally stupid, but for some reason this particular sneer stuck in my mind with a mixture of amusement and disgust and perhaps more than a little horror, since air pollution kills and has been killing 6 to 7 million people per year for decades now while we all wait, like Godot, for the grand renewable energy nirvana that never comes and never will come. Air pollution killed more people today than any day of Covid-19 has killed on its worst day. It will kill more people tomorrow than Covid-19 killed on its worst day. Every day of this month, and next month, and the month after that, air pollution will kill more people than Covid-19 killed on its worst day.
But, at least in the mind of someone here, I needed to know, apparently, all about Purex Tunnel #1 at the Hanford nuclear weapons plant and now, and now, I do.
Solartopia.
I find all of the Harvey Wasserman wannabees tiresome, and after arguing - sometimes heatedly at no benefit to myself or to humanity since it is clear that no amount of information can change these people's minds; indeed they go full Qanon with conspiracy theories at times, I’ve decided simply to ignore them. You know how much... "there is no safe amount of radiation," and "government coverups" and related horseshit… can one take? I've learned to use here the tool not available at Daily Kos, the magnificent DU "ignore list." I am too old to spend too much time on stupidity.
Over the last few years, I've referred, with my penchant for sarcastic shorthand to the evocation of the collapse of Hanford's Purex Tunnel #1 as a kind of catch all for the intellectual (or anti-intellectual) myopia of anti-nukes, their curious, or better incurious, selective attention to the point of obliviousness. I obviously included the author of the evocation in question on my ignore list, but the evocation itself sticks somehow in my mind as an ultimate "head up the ass" statement, a kind of distraction from reality worthy of Fox News on some level. As such, I've referred to it from time to time in this space, and recently, when using a computer on which I declined to log in, I noted that one of my references to this evocation generated some accusatory commentary from a person on my ignore list. For old time's sake, I temporarily shrank my ignore list to remark as follows:
The response was this:
"I will say though, as the post about the collapsed tunnel was a perfect indication of the trivializing mentality of anti-nukes, their almost paranoid belief that if a single atom of a radionuclide is not permanently contained it will magically tunnel into their tiny brains and kill them, it stuck in my mind as a kind of symbol."
Total straw man.
Straw man? Should I be offended?
Let's leave aside the question of whether a lazy reference to a logical fallacy somehow matters in the context of comparison of the collape of Hanford's Purex Tunnel Number 1 to the death of almost 24 million people as of this writing from air pollution since the tunnel's collapse.
It gets better than this, because the Dunning Kruger effect is operative here because a concern about the collapse of Hanford's Purex Tunnel #1 certainly implies something, but perhaps the correspondent, not understanding a damn thing about the subject of the migration of radionuclides which I discussed at length above, the idiot raising the point is completely unaware of what is being implied by raising his or her point about the tunnel collapse on a planet where 18,000 to 19,000 people die every day from air pollution.
In the pharmaceutical industry there is a concept built around biologically active species known as the "BCS classification."
It is usually represented graphically:
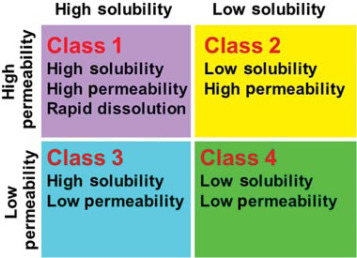
We have already established that PuO2 has very low solubility above, placing it in either BCS Class II or Class IV, but what about it's permeability? Can we determine if it easily cross the membranes of the alimentary canal to get absorbed into the body?
The first known human ingestion of plutonium occurred on August 1, 1944, when a young chemist working on the Manhattan Project, Don Mastick had a vial, containing about 10 mg of plutonium chloride explode in his face with some of it landing in his mouth. (It was not, as reported by Eileen Welsome's otherwise wonderful book The Plutonium Files, the world supply. Gram quantities of plutonium were available by late 1944.) Mastick's stomache was pumped, and some of the plutonium he swallowed was recovered from his feces and urine. In urine, the concentration was extremely low, near the limit of detection, suggesting BCS Class IV. However much he actually absorbed is not precisely known, although his face and breath were radioactive for some time. He nevertheless lived to by 87, dying in 2007.
Many controlled animal studies, and, regrettably, unethical human studies - as detailed in Ms. Welsome's book - were also conducted in subsequent years, and indeed there have been a number of accidental ingestions of plutonium since Dr. Mastick's time.
Much of what we know about the permeability of plutonium comes from fallout from open air nuclear tests, particularly among Marshall Islanders. The "f1" value, absorption seems to be, for the (predominant) oxide to be on the order of 10^(-4) or 10^(-5). (cf. Alimentary Tract Absorption (f1 Values) for Radionuclides in Local and Regional Fallout from Nuclear Tests (Ibrahim, Shawki A.; Simon, Steven L.; Bouville, André; Melo, Dunstana; Beck, Harold Health Physics: August 2010 Volume 99 Issue 2 - p 233-251). This information places plutonium oxide in BCS class IV, which, in pharmaceutical settings is the most problematic class with which to deal. Overall, it means the blood levels from drinking well water at the Nevada National (In)security Site's worst contaminated water, the well water adjacent to at the Chancellor Nuclear Test location, about 55 pCi/liter, at something like 0.003 pCi, implies that one would need to wait about 6 minutes to detect a single nuclear decay from a single plutonium atom anywhere in the human body. This does seem to call into question whether a stupid person whining insipidly about "strawman" arguments while clearly lacking a shred of reasoning ability overall is in fact knowledgeable enough to assert whether my assertion about single atoms is "unfair," although, again, toxic thinking does not deserve fairness at all; sarcasm is entirely appropriate. Implications depend on perceptional ability, and not necessarily the raw value of a statement. If one does not understand what one is saying, one can and often is, a la Dunning-Kruger, unaware of implications.
Despite my disinclination to be "fair," in fairness, to some extent, the permeability is determined by oxidation state, and by complexation, but it is certainly the case that residual plutonium at the site of the Hanford Purex Tunnel #1 site is the oxide, particularly since the radioactivity at the site has been measured, and measured for a real hazard for incorporation of physiological plutonium, inhalation and found not to be elevated above background (See the link above). (The other is injection, or entry through a wound, the latter a situation that may have been obtained in the only nuclear war ever observed, which took place in 1945, over 65 years ago. It would be a sane world in which we spent as much time worrying about oil wars, and the diversion of petroleum products to weapons of mass destruction, as we do to preventing nuclear wars, since nuclear wars are no longer observed, even when certifiably insane people like, say, Donald Trump, have access to such weapons.)
The distribution of plutonium in organs and pharmacokinetics (DMPK) has been studied in mice, using a soluble form of the element, including the nitrate, and the two viable routes of administration, inhalation and injection settings:
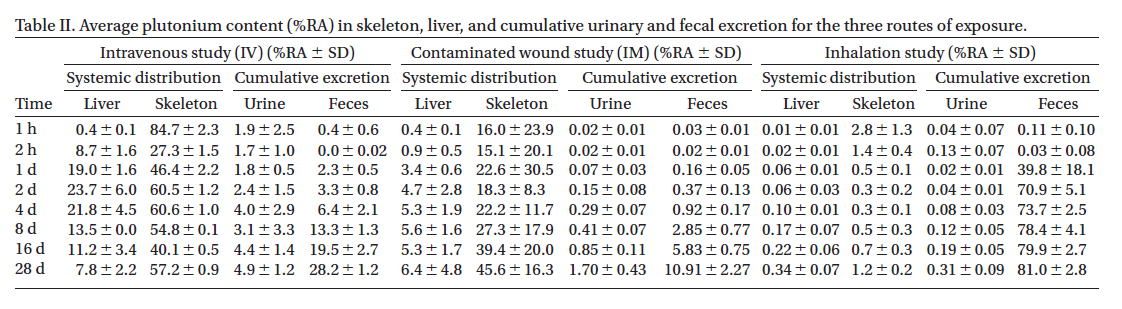
(cf. Table 2, Waylon Weber, Melanie Doyle-Eisele, Dunstana R. Melo & Raymond A. Guilmette (2014) Whole-body distribution of plutonium in rats for different routes of exposure, Int J of Radiation Biology, 90:11, 1011-1018).
A knowledgeable person could argue that in the Purex process, plutonium is present as a (soluble) nitrate, however, the process relies n precipitating the nitrate as an oxalate, which on occasion spontaneously decomposes to the insoluble dioxide. This was almost certainly a problem, often an intractable problem, in the 1950's, when the chemical reactors in Hanford Purex Tunnel #1 were discarded there, and it may be in fact, the reason they were placed there. I have no idea. I do know that up to this day, the issue of the formation of the oxide from the oxalate is still the subject of research: A review of plutonium oxalate decomposition reactions and effects of decomposition temperature on the surface area of the plutonium dioxide product R.M. Orr, H.E. Sims, R.J. Taylor, Journal of Nuclear Materials, Volume 465, 2015, Pages 756-773.
It is very clear that any plutonium remaining on these reactors is in the form of the insoluble dioxide, which is why, in all of the literature and reports on the subject of this super tragic even, the collapse of a 20 meter section of Hanford Purex Tunnel #1, there is no discussion of plutonium.
So what is discussed in this adventure on which millions of dollars have been spent without any evidence that any lives would have been lost without such an expenditure?
What is discussed is technetium and iodine. All isotopes of technetium are radioactive, but the only isotope of serious consideration in nuclear fuel reprocessing is Tc-99. In the case of iodine, two isotopes are present, I-127 which is the natural isotope, and iodine-129, which is a very long lived radioactive fission product, with a half-life of 15.7 million years. There is a 100% chance that if you were born after 1945 that your thyroid contains iodine-129. You have lived your whole life in its presence, just like you have lived your whole life in the presence of radioactive potassium-40. Not all the iodine-129 in your thyroid by the way, comes from open air or even subterranean nuclear weapons testing. The French nuclear fuel reprocessing plant at La Hague used to dump it in the ocean, which I argued, long ago, was a good idea: Radioactive Isotopes from French Commercial Nuclear Fuel Found In Mississippi River.
I wrote:
Most iodide salts are soluble, with some notable exceptions, for instance Hg2I2, mercury (I) iodide, so it is difficult to imagine the form in which the iodine exists in these reactors. An answer might be found by considering the element in its oxidized state, as iodate, IO3-, which historically was used in the days of gravimetric precipitation as an analytical tool, before the widespread use of ICP-OES and ICP-MS, for the determination of uranium, since uranium iodate is insoluble, as is thorium iodate. This is no matter, I’m not going to discuss the iodine any more.
A report from the government, Annual Status Report (FY 2019): Composite Analysis for Low Level Waste Disposal in the Central Plateau of the Hanford Site gives the level of radioactive contamination of Hanford Purex Tunnels #1 (that which partially collapsed) and Hanford Purex Tunnel #2:
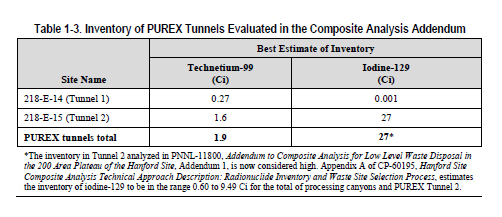
Again, repeating the link above, Sampling Data Purex Tunnels it does not appear that significant quantities of radioactive materials made it to the surface, despite the fact that dust must have been generated. From the Tc activity reported in Hanford Purex Tunnel #1, 0.27 Ci, one can calculate that the total amount of technetium in the combined discarded chemical reactors in the Tunnel was about 16 grams. Hanford Purex Tunnel #1 contained about 97 grams. If one has not joined Greenpeace and can thus be expected to be capable of doing simple mathematical operations, in this case addition, we can see there were 113 grams of technetium total.
Here is a sampling (for Tunnel #2) of what your government did to address these 15.8 grams of technetium in Hanford Purex Tunnel #1 and 97 grams in Hanford Purex Tunnel #2 according the FY 2019 Annual Status Report on the Hanford "Cleanup:"
A structural evaluation also identified a future threat of failure for Tunnel 2, which contains 28 railcars with contaminated processing equipment and materials generated during Hanford’s weapons production mission. DOE-RL addressed this threat by void filling Tunnel 2 with engineered grout in FY 2019. Grouting was placed in Tunnel 2 from October 2018 through April 26, 2019. The filling required approximately 4,000 truckloads (40,000 cubic yards) of grout. Cameras in the tunnel were used to ensure the grout flowed the length of the tunnel and around the contaminated equipment inside. The grout was injected in several lifts, or layers, and each lift was allowed to set before the next began. Final closure of the tunnels will be coordinated with future remedial actions of the PUREX canyon as part of the 200-CP-1 Operable Unit (OU). PNNL-11800, Addendum 1 provides a bounding sensitivity analysis for the impact of the composite analysis results of the PUREX tunnels.
Maybe it's just me, but I can't help wondering if more people faced serious effects from the diesel fuel waste (aka "air pollution) used to power 4,000 cement mixers carrying 4,000 loads of "engineered grout" containing lime which was unquestionably prepared by heating calcium carbonate to over 1000°C for hours in a rotating retort, using the combustion of dangerous fossil fuels to provide the heat and probably the motor to drive the rotating retort than would ever have faced such a risk from the technetium in Hanford Purex Tunnels #1 and #2 if nothing had been done.
Here's why:
The Purex process, as was most likely practiced at Hanford, involves the mechanical chopping of fuel rods, following oxidative dissolution of the oxide fuel within them using nitric acid, followed by extraction - generally with kerosene as a solvent for various alkyl phosphates and related complexing agents. During this process, the technetium fission product is oxidized to the pertechnetate ion, TcO4-. (HTcO4 is a strong acid.)
The pertechnetate ion, in which the oxidation state is +7, has been widely studied for its behavior in geological formulations, and is known to be quite mobile; it rarely if ever is adsorbed by minerals unlike another highly soluble fission product cesium, in all its heavy isotopes. This behavior accounts for the unexpectedly low concentrations of Ru-99, technetium's decay product, at the fossils of the Oklo natural nuclear reactors.
The pertechnetate ion is the form of technetium that people eat for medical tests involving technetium imagining, eating technetium being currently the main use for the element. The isotope of technetium utilized in these tests is far more radioactive than the technetium in Hanford Purex Tunnels #1 and #2. It is the nuclear isomer, Tc99m, of the technetium in the tunnel, Tc99, to which the Tc99m decays with a half-life of 6.01 hours. Over a period of days and weeks, the Tc99, with a half-life of 211,100 years is excreted into toilet bowls, whereupon it finds its way into groundwater, or rivers, or lakes, and eventually into the ocean, where it joins technetium there from nuclear weapons testing, and some from the release by weapons plants like Hanford, as well as commercial fuel reprocessing plants like Sellafield in the UK.
The typical dose of Tc-99m is 10 mCi, this translates, given the 6.01 hour half-life, to 1.9 nanograms of technetium. At the moment of ingestion, the human body is roughly 87,000 times more radioactive than it is from the radioactivity connected with essential potassium (from K-40).
Information about the radioactivity, biological half-life, and dosing is given here: University of Michigan, Radioactive Safety Guide, 99m-Tc. After 24 hours, depending on the globular filtration rate, about half of the two nuclear isomers of Tc-99 has been excreted, and half remains in the body. Of this about 6.28% remains the highly radioactive 99mTc, and the rest is Tc-99, the same isotope in the Hanford tunnels. The activity of the Tc-99 remaining in the body is 0.035 Beq, meaning that about 28 seconds is required on average for an atom of Tc-99 to decay.
One may ask, given the mobility and solubility of technetium, as well as the fact that the Purex process certainly involves acidic aqueous solutions, why it is even there in the terrible Hanford Purex Tunnels #1 and #2, with which I was presented here - this to justify my acceptance of tens of millions of air pollution deaths every decade since the tunnels were first built – why is the technetium even there? Given its solubility and mobility, shouldn’t it have leached away?
Here is a Pourbaix diagram for technetium:
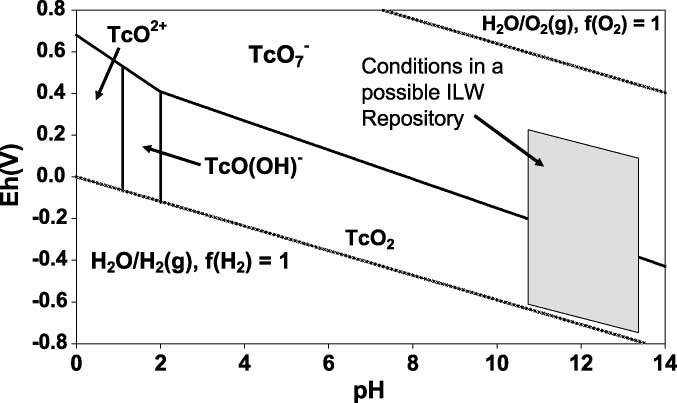
The solubility of technetium(IV) at high pH (Peter Warwick , S. Aldridge , Nick Evans and Sarah Vines Radiochim. Acta 95, 709–716 (2007))
Here is another, where pH is substituted with sulfide species concentration and superimposed on a Pourbaix diagram of the iron/sulfate/sulfide system.

The caption:
([TcO4?] 10?5 M, pH 7.9, 25 °C) . Reprinted with permission from ref 80. Copyright 2013 American Chemical Society.
Technetium Stabilization in Low-Solubility Sulfide Phases: A Review
(Carolyn I. Pearce, Jonathan P. Icenhower, R. Matthew Asmussen, Paul G. Tratnyek, Kevin M. Rosso, Wayne W. Lukens, and Nikolla P. Qafoku ACS Earth and Space Chemistry 2018 2 (6), 532-547)
...from the supplementary information of...
Reductive Sequestration of Pertechnetate (99TcO4–) by Nano Zerovalent Iron (nZVI) Transformed by Abiotic Sulfide
(Dimin Fan, Roberto P. Anitori, Bradley M. Tebo, Paul G. Tratnyek, Juan S. Lezama Pacheco, Ravi K. Kukkadapu, Mark H. Engelhard, Mark E. Bowden, Libor Kovarik, and Bruce W. Arey Environmental Science & Technology 2013 47 (10), 5302-5310)
While the TcO4- anion, in the +7 oxidation state of technetium is very soluble and very mobile, the dioxide of technetium is not.
The solubility increases, albeit by a minor amount, as solutions become very basic via the formation of a hydroxide complex, but the solubility is trivial.
Here, from the 2007 Radiochimica Acta paper cited above in connection with the technetium Pourbaix diagram is a figure reflecting that solubility:
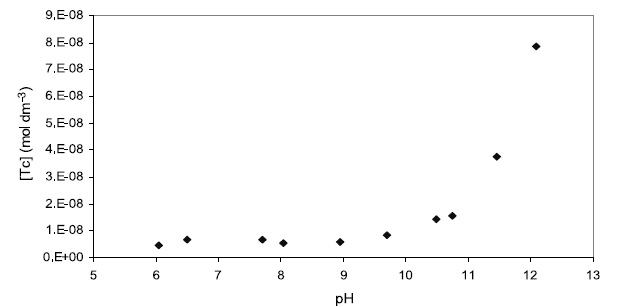
Rain water is not basic; it tends to be acidic, particularly when polluted by dangerous fossil fuel waste. We can see that from the acid side of the above diagram, as far as it goes toward the acid side (pH = 6) TcO2 is very insoluble. Even at the highest pH in shown in the graph, the concentration of TcO2 in water rises to only 80 billionths of a mole, trivial.
The Radiochimica Acta paper is all about the solubility of TcO2 in the presence of two reducing agents. A table of solubilities provided in the paper showing the solubility using two different reducing agents. That table is this one:

The reducing agent is iron in the +2 oxidation state in this paper, an oxidation state present whenever metallic iron rusts. It turns out that many times when people suggest the appalling idea of putting technetium in a dump, the discuss doing so in the form of an iron/technetium metallic alloy, relying on the reduction of technetium to insoluble TcO2. I will briefly discuss why dumping this valuable element is a dumb idea below.
Of course, some TcO2 dissolves. I don't happen to know the pH of the groundwater at the Hanford Nuclear Reservation, but I very much doubt it is above 11, which is getting into Drano territory. From the Radiochimica Acta graphic just shown, if the pH is less than 11, we can safely assume that the solubility is well below any of the values cited in the table just above.
Let's take the highest value measured for the solubility of iron reduced TcO2 from the table above, 2.3 X 10^(-9) (2.3 nanomoles) at the lowest pH at which it was measured 11.8. The molar specific activity of technetium-99 is 6.26 X 10^(10) Beq/mol. It follows, if one has not joined Greenpeace and can therefore do arithematic, that the amount of radioactivity in a liter of water at pH 11.8 saturated with TcO2 is 144 Beq.
The reactors in the tunnel at Hanford undoubtedly contain steel, as does the rail cars on which they were stored, as does the tracks on which the railcars were packed. It is therefore very, very likely that the reason that it was not possible to detect a huge amount of technetium related radioactivity around the collapsed tunnel is that it is not mobile TcO4- but is rather insoluble TcO2.
But we can extend this further. The figure of 144 Beq/liter applies only at the very local region of water in direct contact with the TcO2. As the technetium diffuses, the concentration decreases by dilution via diffusion or flow, and/or absorption.
I suppose one could go crazy doing calculations about this situation considering Fick's law of diffusion, or modifications of it to get diffusion advection equations in the case of flow. One could even go crazier, arguing all day whether a Stokes-Einstein formulation of the diffusion constant is appropriate with or without Langmuir or Freundlich corrections apply.
It is clear, or should be clear, that the concentration of technetium dioxide will decrease the further one gets away from the terrible tunnels of fear that was exposed by the anti-nuke who thinks I should study his or her utterance to see if he or she ever was arguing about a single atom of radioactivity in what is clearly his or her poorly applied brain. The most likely case - and this is the real point, the argument being made about whether or not the collapse of a tunnel at Hanford is an argument against using nuclear energy to save human lives that would be and in fact, are otherwise lost to air pollution, numbering in the hundreds of millions in two or three decades, is full of implications. Diluting the a liter of most concentrated TcO2 solution at pH 11.8 to 1000 liters, would amount to concentrations of a single atom decaying in a liter of water, making it far less radioactive than the seawater in which life evolved.
During a recent virtual meeting of the American Chemical Society, I had the privilege of attending a lecture on the subject of technetium by Dr. Carolyn Pearce a geochemist at the Pacific Northwest National Laboratory, the laboratory associated with the Hanford Reservation, where the tunnel collapsed. There is a lot of technetium at Hanford, of course, in the "waste" tanks, and elsewhere, but, as in the case with the collapsed tunnel, the quantities and location are mostly known. According to Dr. Pearce's lecture, as I recall it, she indicated that there was about 500 Ci that is "missing," that is, the scientists at Hanford don't know where it is but they believe it is "somewhere."
Five hundred Ci of technetium, using the conversion factor that a Ci is equal (exactly) to 3.7 X 10^(10) Beq, which translates, given the specific activity of Tc-99, to about 1.8 X 10^(13) Bq, and further translates to just under 30 kg of the pure metal. As of this writing (06/12/21) , the flow rate in the Columbia River, on which the Hanford reservation is located, is 194,000 cubic feet per second. This is the lowest amount ever recorded since records have been kept, and it is most likely the result of climate change, which is accelerating because we don't go nuclear against climate change. (The previous low, recorded in 2016, was 213,000 cubic feet per second.) This low flow rate translates into around 5.5 million liters per second. This means that if all 500 missing Ci of technetium were instantaneously, within one second, injected into the Columbia River, the concentration in the river would be momentarily 3.3 million Bq/liter, or about 9 microcuries/liter, roughly the amount of radioactivity that one drinks for a Tc-99m medical imaging test. If, by contrast, 500 Ci of technetium leached out over a day, with 86,400 seconds in a day, the concentration would be about 40 Bq/liter, and if it leached out over a year, 0.2 Beq/liter, over 10 years, the activity would be lower than the activity of seawater from the natural decay of natural radioactive potassium-40. Of course, this technetium has not leached out in periods much longer than this. To the extent geological technetium encounters zero valent or low valent iron, it will leach at rates much lower.
The Columbia River terminates near a large city, Portland Oregon, which has some of the the highest life expectancy, 89.1 years, in the Northwest portion of the city, which many not because of the proximity of the Hanford reservation, but in spite of it. The effect of Hanford on life expectancy in Portland is unknown. Nevertheless, the citizens of Portland Oregon, could not, and have never, drank the full contents of the Columbia River; unlike the Colorado River, it still flows to the sea. An argument about 500 Ci of technetium getting into the river - an argument I have just made - is just silly.
If it happens that an anti-nuke is uneducated enough and or uninterested enough not to know what he or she is saying, or implying, it is clear to me that I'm no more interested in doing anything but ignoring such a person, - except to make a point about the general mentality of the type as I'm doing here - just like I ignore the more famous toxic fool Harvey Wasserman. Is it worth examining what a moron did or did not actually say? Harvey Wasserman will say he gives a shit about fossil fuels and about climate change, but the reality is that Harvey Wasserman never held a concert with big rock stars using amplifiers powered by the combustion of fossil fuels to raise money to ban fossil fuels. From this, it's entirely clear, who and what he is. Harvey Wasserman, I have argued, is not worth the time wasted considering what he does or does not say. He is an anti-science moral and intellectual Lilliputian. His or her writings imply that he doesn't give a shit about how many people die every damned day from air pollution, and any lip service he gives to it with stupid ravings about Solartopia do not matter, since chasing after Solartopia at a cost of trillions of dollars has not arrested climate change nor has it reduced the loss of life from air pollution.
Does it matter that an anti-nuke here freaks out about a tunnel collapsing at Hanford? Is there some reason that I should be studying his or her writings here to see what he or she did and did not say? How about Jenny McCarthy? The anti-nuke, anti-vaccine, anti-wind, anti-GMO nutcase Robert F. Kennedy Jr?
The fact is, that if you are calling someone's old post about nuclear energy to report that it has implications to prevent nuclear energy from saving lives, which it does, it is the equivalent of calling for a ban on fossil fuels because one has encountered a school bus that is spewing black smoke from burning oil in a failing engine.
We are in Dunning-Kruger territory, a region of Trumpian disinformation given out of ignorance.
In interviews available on the internet, Dunning makes the valid point which is this: You don't have to be as dumb as Trump to display the effect, everyone displays the effect. I have heard and even read about the much discussed among certain subsets of very brilliant scientists about topological insulators, but if I made any claim about them, or engaged in an argument concerning them, I would be in Dunning Kruger territory.
It is one thing to not know something, quite another to deliberately ignore facts. Facts matter.
I recall - I read it a very long time ago - that in the opening pages Abraham Pais's biography of Albert Einstein, Subtle is the Lord: The Science and Life of Albert Einstein, Pais, who knew Einstein personally and was his friend as a young man, recounts walking down Mercer Street with the famed scientist having an argument about whether the moon exists when it is behind a cloud or has not risen.
This was, of course, about the "Copenhagen Interpretation" of quantum mechanics. Einstein objected strongly to the "Copenhagen Interpretation" of the discipline he had done so much to found.
Nevertheless, it is impossible to even remotely state how much of the modern world, the science and the technology - everything from cell phones to medication, to TV sets and computers - depends on the fact that Einstein, one of the greatest scientists ever known, had entered into Dunning-Kruger territory.
Comparison of the moon to an electron, while made by one of the greatest minds the world has ever known, is perhaps not all that different than comparing the risks a collapsed rail tunnel to the roughly 25 million deaths from air pollution that have taken place since the Hanford Tunnel collapsed, exciting a breathless comment over in the E&E forum in one of my old threads. But we can be sure that Albert Einstein knew the difference between the moon and an electron.
It is clear that Harvey Wasserman has never looked, and doesn't care, despite any and all mutterings he might make to the contrary, about the difference in the death toll from dangerous fossil fuels and nuclear energy that have taken place in his long and criminally useless life, a difference that is idiot rhetoric did much to cause. The scale is Trumpian.
There was no greater America than the one Trump did so much to destroy, and there is no better source of clean energy than nuclear energy.
I apologize for posting this very long post, even as I do it. I trust you will have a pleasant weekend, assuming you wasted time getting here.
The world of two-dimensional carbides and nitrides (MXenes)
There's a nice review article on these amazing structures, first derived from the ternary MAX phases, first studied in great detail by (but not discovered by) Michel Barsoum, who - not that anyone cares what I think - I think should be a candidate for the Nobel Prize.
Dr. Barsoum is an Arab American scientist at Drexel University. My son had an opportunity to sit for a time with him while attending an "accepted students" meeting at Drexel, but took a better financial offer elsewhere. I was slightly disappointed that Drexel hadn't made a competitive offer, because well, Dr. Barsoum...
I'd been studying the MAX phase literature for some time, owing to my strong interest in refractory materials and titanium chemistry. (The most famous MAX phase is Ti3SiC2. )
The MAX phases are materials that combine the best properties of metals, electrical conductivity, machinability and fracture resistant strength, with the best properties of ceramics, high melting points, resistance to corrosion and resistance to deformation. They generally form in layered structures, or if not layered, in highly structured arrays.
The MAXenes are made by special dissolution properties acting on MAX phases, for example, the dissolution of Silicon layers using HF.
The review article here: The world of two-dimensional carbides and nitrides (MXenes). (Armin VahidMohammadi, Johanna Rosen, Yury Gogots, Science 372, eabf1581 (2021))
Two of the authors are from Drexel, and one from Sweden.
It's a review article, and I cannot cover much of it, but if you happen to get access to Science, it is a very interesting topic.
I can share the introduction to the review and a few graphics to get a feel for the topic.
A brief excerpt of the introduction:
Ti3C2Tx was made by selective etching of monoatomic Al layers from the Ti3AlC2 MAX phase precursor in hydrofluoric (HF) acid (1). High metallic conductivity, hydrophilicity, and the ability to intercalate cations and store charge, demonstrated by Ti3C2Tx (4, 5) and other MXenes (6, 7), initially led to interest in exploring MXenes for energy storage applications. The year 2017 was the beginning of the MXenes “gold rush.” Since then, the world of 2D carbides and nitrides has been growing at an unprecedented rate. There are currently more than 30 different experimentally made stoichiometric MXenes and more than a hundred (not considering surface terminations) theoretically predicted MXenes (8–10) with distinct electronic, physical, and (electro)chemical properties. In addition, solid solutions on M and X sides are possible, and the possibility of having multiple single (O, Cl, F, S, etc.) or mixed (O/OH/F) surface terminations makes MXenes a large and diverse family of 2D materials.
The variety of MXene structures and compositions (Fig. 1) makes it necessary to define a terminology for MXenes. The general formula of MXenes is Mn+1XnTx, where M represents the transition metal site, X represents carbon or nitrogen sites, n can vary from 1 to 4, and Tx (where x is variable) indicates surface terminations on the surface of the outer transition metal layers (8, 11). As an example, the chemical formula of a titanium carbide MXene with two layers of transition metal (n = 1) and random terminations would be Ti2CTx, and a completely oxygen- or chlorine-terminated Ti2CTx can be written as Ti2CO2 or Ti2CCl2, respectively. If there are two randomly distributed transition metals occupying M sites in the MXene structure forming a solid solution, the formula will be written as (M?,M??
 n+1XnTx, where M? and M?? are two different metals [e.g., (Ti,V)2CTx)]...
A few figures:

The caption:
2D MXenes have a general formula of Mn+1XnTx, where M is an early transition metal, X is carbon and/or nitrogen, and Tx represents surface terminations of the outer metal layers. The n value in the formula can vary from 1 to 4, depending on the number of transition metal layers (and carbon and/or nitrogen layers) present in the structure of MXenes, for example, Ti2CTx (n = 1), Ti3C2Tx (n = 2), Nb4C3Tx (n = 3), and (Mo,V)5C4Tx (n = 4). In contrast to all previously known MXenes, the recently discovered Mo4VC4Tx solid solution MXene with five M layers shows twinning in the M layers (146). The M sites of MXenes can be occupied by one or more transition metal atoms, forming solid solutions or ordered structures. The ordered double transition metal MXenes exist as in-plane ordered structures [i-MXenes, e.g., (Mo2/3Y1/3)2CTx]; in-plane vacancy structures (e.g., W2/3CTx); and out-of-plane ordered structures (o-MXenes), where either one layer of M?? transition metal is sandwiched between two layers of M? transition metal (e.g., Mo2TiC2Tx) or two layers of M?? transition metals are sandwiched between two layers of M? transition metals (e.g., Mo2Ti2C3Tx). Other arrangements, such as one or three layers of M?? sandwiched between the layers of M? (bottom row) in the M5X4 structure, may be possible. Faded images at the bottom of the figure represent predicted structures such as high-entropy MXenes and higher-order single M or o-MXenes that have yet to be experimentally verified.

The caption:
(A) Schematic illustration of different compositional and structural factors determining electronic and optical properties of MXenes. (B) Total DOS for Mo2TiC2O2 and Mo2Ti2C3O2, showing the effect of MXene structure (40). (C) DOS of Ti3C2, Ti3C2O2, Ti3C2(OH)2, and Ti3C2F2, showing the effect of surface chemistry on electronic properties of MXenes (44). (D) Dependence of the work function of MXenes on their surface chemistry (45). (E) The color of colloidal solutions of various MXenes and their corresponding freestanding films (54). (F) Digital photographs of three M?2-yM?yCTx solid solution systems, showing the change in optical properties and color of freestanding MXene films due to a gradual change in the stoichiometry (55). (G) UV-vis-NIR optical extinction properties of aqueous dispersions of various 2D transition metal carbides (54). (H) UV-vis-NIR transmittance spectra from 300 to 2500 nm for MXene thin films (54). (I) Tensile stress versus strain curves of Ti3C2Tx films with different thickness produced by vacuum-assisted filtration and blade coating (60). (J) Force-deflection curves of a bilayer Ti3C2Tx flake at different loads. The lower inset is a detailed view of the same curves showing the center of origin. The top inset shows an AFM image of a punctured flake with no sign of catastrophic rupture (61). (K) Comparison of the effective Young’s moduli of single-layer Ti3C2Tx and Nb4C3Tx with other 2D materials tested in similar nanoindentation experiments (62). [(B) to (K) adapted with permission from (40, 44, 45, 54, 55, 60–62)]

The caption:
Fig. 3 Synthesis and processing of MXenes.
(A) Schematic illustration of two approaches to produce MXenes by removal of A layers from MAX phases and related layered compounds. In the first approach, the MAX phase is selectively etched in fluoride ion–containing acids. By this method, multilayered MXene particles or in situ delaminated 2D flakes (using the MILD method) can be obtained. In the second approach, the MAX phase is selectively etched in molten salts. The product is usually multilayered MXene particles, which can then be delaminated through intercalation. (B) Scanning electron microscope (SEM) image of a hexagonal-shape Ti3AlC2 MAX phase crystal (52). (C) SEM image of a Ti3C2Tx MXene particle, derived from Ti3SiC2 by selective etching of Si layers in molten salt (36). (D) Top-view SEM image of a delaminated Ti3C2Tx flake (52). (E) STEM image of a M3AX2 MAX phase (Ti3AlC2) particle. (F) The corresponding STEM image of an ml-M3X2Tx MXene particle (Ti3C2Tx). (G) Atomically resolved plane-view STEM image of single-layer Ti3C2Tx (28). (H to J) Digital photographs of ~1 L of delaminated Ti3C2Tx solution (166), highly concentrated Ti3C2Tx ink (167), multilayered Ti3C2Tx MXene particles (166), a Ti3C2Tx film prepared by vacuum-assisted filtration of a colloidal MXene solution (168), and large-area, mechanically robust Ti3C2Tx film produced by blade coating (60). [(E) and (F) courtesy of P. O. Å. Persson; (B) to (D) and (G) to (J) adapted with permission from (14, 28, 36, 52, 60, 166, 167)]
I hope to find some time to spend with this article. These are ground breaking materials.
Have a nice day tomorrow.
Listen guys, I hate to tell you this, but you've got missing planes.
I always love to read the part of Journals, almost always at the end of an issue, where one scientist or group offers a commentary on an earlier paper and receives a response from the original authors commenting on the comments made. Sometimes these exchanges can border on hostility, but at other times, it can be an enlightening exchange.
Such an exchange took place in the current issue of Nature as of this writing. It's an article about lead perovskites, which are often proposed as components of solar cells and other opticoelectronic devices. (In Nature, this type of exchange is called "Matters Arising." )
The comment, "Hey guys, you've got missing planes: Deng, YH. Perovskite decomposition and missing crystal planes in HRTEM. Nature 594, E6–E7 (2021).
From the text of the comment:
It is noteworthy that only the (22¯4), (224) crystal planes appear, and that the (11¯2), (112) crystal planes are missing in HRTEM characterizations in the original paper1. Figure 1a shows the structure of MAPbI3 and Fig. 1b shows the simulated electron diffraction along the [2¯01] zone axis. Clearly, (11¯2), (112) planes exist in the electron diffraction pattern. Moreover, (11¯2), (112) planes are also present in HRTEM images under low electron dose2, selected-area electron diffraction (SAED)3,4 and X-ray diffraction (XRD)5,6,7 characterizations.
Clearly...
Fig. 1: Ball and stick models, simulated electron diffraction patterns of MAPbI3, PbS and PbI2.

The caption:
Additional text:
...In light of above clarification, the structure in the HRTEM images of the original paper1 is more likely to be PbI2, and the higher-contrast spots are caused by the mass thickness contrast effect13. Owing to lack of the corresponding in situ high-angle annular dark-field scanning transmission electron microscopy (HAADF-STEM) image in the original paper, it is impossible to prove that the higher-contrast spots are PbS quantum dots rather than PbI2 particles. Next, the authors should check the experimental conditions of HRTEM, especially the dose of the electron-beam irradiation. If possible, it would also be better if they compared the particle size and size distribution of colloidal quantum dots and quantum dots in perovskite in the original paper.
The original author's response is here: Ning, Z., Gong, X., Comin, R. et al. Reply to: Perovskite decomposition and missing crystal planes in HRTEM. Nature 594, E8–E9 (2021).
In the accompanying Comment2, Deng asks whether there is enough evidence for PbS being embedded into perovskite, and in particular whether TEM images in the original Letter correspond to PbI2 as opposed to perovskite or PbS. Deng noted a difference in the estimated interplanar angle in his analysis of our published data (Deng finds 57°) compared to the value we report (60°). Deng also points out the absence of a diffraction spot related to the (112) plane of perovskite and suggests possible perovskite degradation.
The coexistence of perovskite and quantum dots is supported in the original Letter1 by optical absorption spectra, static and transient photoluminescence spectra, photoluminescence excitation spectra, X-ray photoelectron spectroscopy (XPS), high-angle annular dark-field imaging scanning transmission electron microscopy (HAADF-STEM) and Rutherford backscattering spectrometry (RBS). The density functional theory (DFT) simulations show that epitaxial alignment is possible and is needed to avoid interfacial traps.
In light of Deng’s questions, we revisited the analysis of the interplanar angle and the missing diffraction spots. Since the fast Fourier transform (FFT) is performed on a small subsection of the image to capture the PbS and perovskite lattices separately, the resulting diffraction pattern is diffused, and this leads to a range in determining the centre of each spot, and consequently to a range in angular estimates. Both pre-2015 and contemporaneous 2015 high-resolution transmission electron microscopy (HRTEM) studies also lacked evidence of the (112) plane reflection3,4,5,6,7,8,9. We agree that there is a possibility of perovskite degradation to PbI2 (ref. 3).
Given this possibility, we sought therefore—in light of advances in transmission electron microscopy (TEM) over the past six years—to investigate the materials using improved TEM equipment (aberration-corrected JEOL GrandARM (ARM300F)). We used the method of sample preparation described in the 2015 Letter1. We reduced the electron dose to 10 e Å?2 (e, electron charge), and see the characteristic Fourier spots attributed to {110} facets of MAPbI3 (Fig. 1a, b, d)...
In other words, "we credit what you say Professor Deng, and we went back and did it all over again with instruments that are more advanced than those we had in 2015..."
Fig. 1: TEM analysis of quantum dots in perovskite.
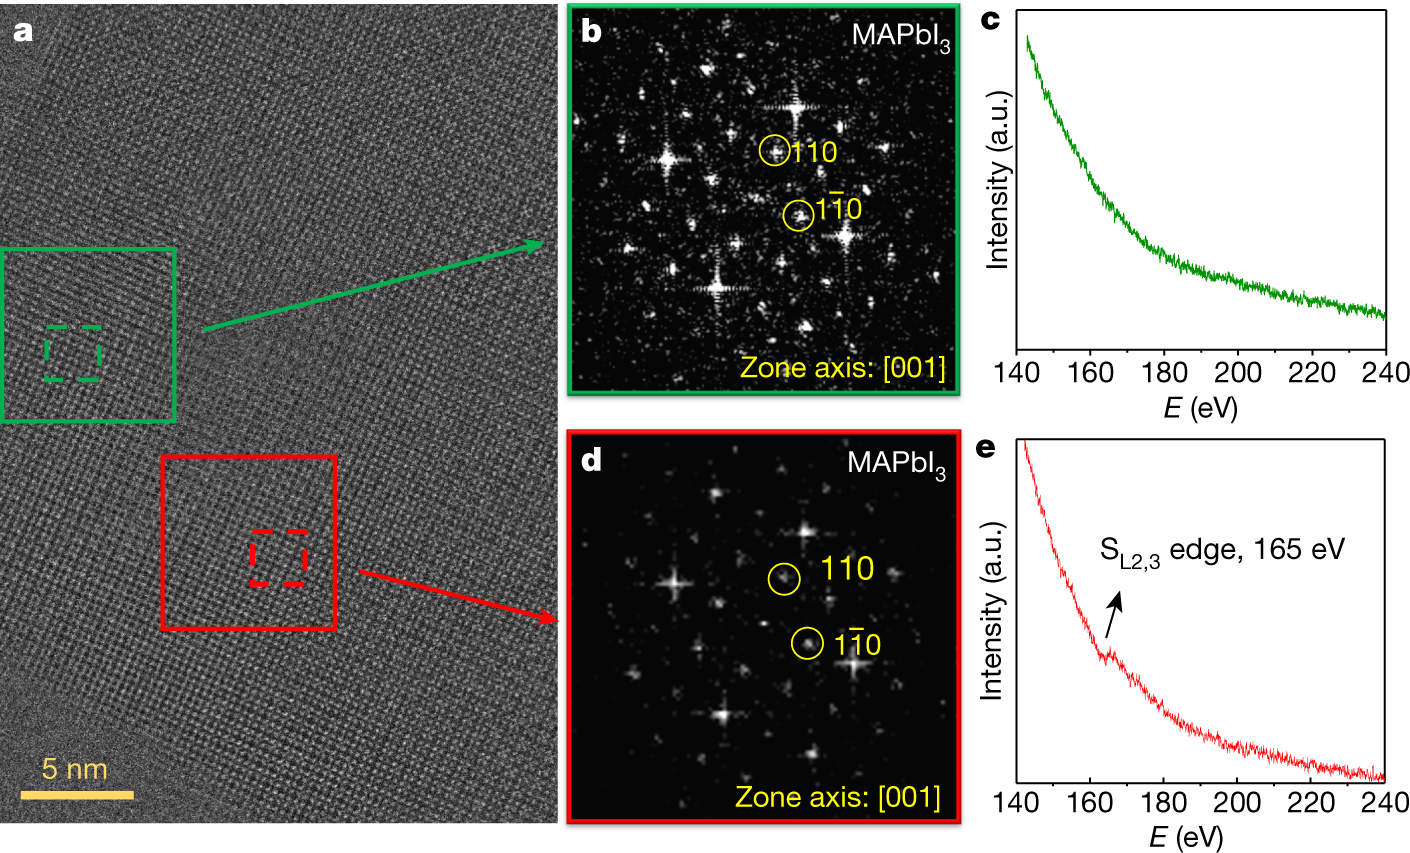
The caption:
Some more text:
The new HRTEM images and the accompanying elemental analysis, together with optical and electronic properties, XPS and RBS from the original Letter, support the finding of dots in perovskite. The evidence of epitaxial alignment comes from the suite of characterization studies reported in the original work. Specifically, DFT reveals that the interfacial energy between PbS (110) and MAPbI3 (110) is less than 10 meV Å?2, suggesting that the epitaxial growth of perovskite on PbS is as energetically feasible as homoepitaxy of PbS on PbS or perovskite on perovskite...
...The use of PbS quantum dots in perovskite has been further investigated by a number of groups. Jung et al. reported using DFT that high-quality heteroepitaxy between PbS (100) and CsPbBr3 (100) was energetically favourable for both materials11. Masi et al. demonstrated the role of lattice matching at the heteroepitaxial interface between perovskite shell (MA) and PbS CQDs and its influence on the optoelectronic properties of PbS CQDs. High mobility (1.3 cm2 V?1 s?1) and high detectivity (2 × 1011 cm Hz1/2 W?1 with >110 kHz bandwidth) was achieved when the lattice constant mismatch is minimized between PbS and the perovskite shell12. Zhang et al. reported, on the basis of HRTEM, epitaxial coherence between the CsPbI3 and PbS CQD lattice13. Liu et al., using TEM, reported that CsPbBrxI3?x perovskites inherit the crystalline orientation of the embedded PbS quantum dots14. Improved performance has been observed in PbS-dot-in-perovskite solar cells, photodetectors, and light emitting diodes13,15,16,17.
We once again thank Deng for having motivated a fruitful dialogue and updates to the TEM studies of the original paper.
A pleasant exchange, I think.
The original paper is here: Ning, Z., Gong, X., Comin, R. et al. Quantum-dot-in-perovskite solids. Nature 523, 324–328 (2015).
I am not, by the way, competent in TEM analysis, and frankly some of this is over my head, but I shared these papers with my son who does a lot of imaging work in connection with his research.
As for lead perovskite solar cells, from my perspective, they are even worse than the existing solar industry since distributed lead solar cells is an even worse idea than distributed solar energy, and distributed energy is a bad idea since it ultimately results in distributed (and thus difficult to ameliorate) pollution. (There's going to be hell to pay for future generations for this pixilated affair.)
It doesn't matter of lead perovskites can make marginally more efficient solar cells. The "solar will save us fantasy" after half a century of wild cheering has not worked, is not working and won't work to displace dangerous fossil fuels and address climate change.
The the science involved with researching the matter, however, is surely of value. Many perovskite structures involve cesium chemistry, and I personally love the fascinating chemistry of that sometimes obscure element.
Have a nice day tomorrow.
Extraction of Desalinated Water from Brine with Diisopropyl and Tripropyl amines.
The paper I'll discuss in this post is this one: Molecular Simulation of High-Salinity Brines in Contact with Diisopropylamine and Tripropylamine Solvents (Praveenkumar Sappidi, Gabriel Barbosa, Brooks D. Rabideau, Steven T. Weinman, and C. Heath Turner Industrial & Engineering Chemistry Research 2021 60 (21), 7917-7925)
It is abundantly clear that all efforts to address climate change have failed, despite lots of rhetoric and websites, and big Live Earth rock concerts with hirsute heavy metal guitarists wearing "No Nukes" tee shirts, and Bill McKibben's 350.org website and Greenpeace websites featuring protests with people wearing monkey suits or rock climbers hammering pitons into the sheer faces of huge landmarks to hang insipid banners as part of puerile bourgeois "protests," and slick corporate ads about electric cars showing wind turbines and solar farms in the background.
I personally find this unsurprising, but that's just me. Everybody else seems to be still gushing interminably over "going green," although if one really looks, it takes very minimal effort to see that things are getting worse, much worse, not better.
This said, we live in the age in which lies are celebrated as lies, and the lies we love best are those we tell ourselves.
The waste from these expensive efforts of no result, the effort "to go green," will remain with humanity, basically, forever. This includes the stuff that will leach out of all the fracking holes we drilled to get "transitional" dangerous natural gas that was never, not ever, really "transitional" at all. Beyond that, the purpose of my generation was to consume all of the world's best ores, as much of the dangerous fossil fuels as possible, all of the land, all of the forests, all the best copper ores, all of the indium, all of the dysprosium, all of the neodymium, all the praseodymium, all of the cobalt so we could declare ourselves "green," and "sustainable."
Above all of the things we have robbed from all future generations, in full and barely obscured contempt for them, this on a planet dominated by seas and oceans, is clean fresh water. Many of the shortages of fresh water are connected with climate change, others ironically are the function of impeded riverine flows, still others relate to the poisoning of water sources, in particular, ground water with industrial, agricultural and consumer chemicals, and especially in the age of fracking, but not limited to it, mining.
Some years ago I was trying to write an elaborate intricate arcane novel about unhappy doomed people, and to do this in a kind of isolation, I'd spend an hour every morning in a little coffee shop in my town. Ultimately the coffee shop shut, driven out of business by rent and Starbucks, and the worthless novel was put away for other reasons, but toward the end of the affair I sometimes found myself chatting with the owner of the coffee shop, who sold great coffee, nice high end chess sets, and very snazzy neck-ties. Somehow the owner gleaned that I knew a lot of science, and one day, during a terrible drought in New Jersey that was killing old magnificent trees and lots of other things, the owner asked "Why don't we just desalinate ocean water."
Why don't we just...?
I probably gave him a one word answer, which was "Energy," but the truth is that I read a great deal about the state of water on this planet, and I think all the time about ways to save it or restore it, and I believe I've written in this space on this subject a number of times, although I do of late, as life winds down, lose track of my own drivel as it becomes more spitting into the wind.
My favorite scheme for water purification using seawater is phase separation under supercritical conditions - for which there is a set of problems for which I can at least imagine solutions - but there is always of course, distillation, or flash distillation, albeit involving materials science issues similar to the supercritical case, although large water distillation desalination plants have been built. Of course, membrane methods also exist and are probably the most commonly practiced method, often described as "reverse osmosis" although there are "forward osmosis" schemes as well. These have different sets of problems.
I read a lot, but somehow I never came across a method like the one being modeled in the paper referenced at the outset, solvent extraction of water from brine.
So I thought I'd write a little bit about it here, since sometimes threads at DU serve me as kinds of "Post-it" notes.
The introduction to the cited paper focuses heavily on water contaminated by mining processes, particularly on "transitional" natural gas (and oil). (The growth in use of "transitional" natural gas is easily outstripping so called "renewable energy" (measured in units of energy as opposed to putative "peak" capacity) and has been doing so for decades.)
An excerpt from the beginning of the introduction:
Reference 8 is a short 2004 National Academy Press Book, which is available for free download: Review of the Desalination and Water Purification Technology Roadmap
It contains this deliciously hopeful text:
We're past "by 2020;" it's widely reported that this is 2021, one year after "by 2020." Are we there yet? How about all the "entirely new" energy sources. In 2004, this statement was presumably about so called "renewable energy," and was before trillion dollar "investments" were made in solar and wind energy with no meaningful effect on even slowing the degradation of the entire planetary environment.
If one is in the habit of making predictions, it is useful to look a predictions made many years ago. We generally don't do that. When I do it, I generally meet with an uncomfortable mixture of amusement, cynicism, and outright disgust. It's why, even though I'm a political liberal who actually cares about the future of the planet, I am completely disabused of my former, de rigueur (among political liberals) enthusiasm for solar and wind energy. I hope I'm not being too egotistical in claiming I am familiar with something called "critical thinking."
The excerpted introduction to the paper continues:
...Overall, solvent extractive desalination (SED) has several advantages, such as the lack of a membrane (minimizing maintenance), moderate operating temperatures (40–60 °C), and solvent recyclability after water decantation.
Rish et al.(16) performed SED experiments using DA as the solvent and showed salt rejection rates as high as 98–99%, which is equivalent to RO performance. Guo et al.(17) also performed SED experiments and simulations using DA as the solvent for separating arsenic from contaminated wastewater, and the demonstrated separation efficiencies were as high as 91% for As(III) and 97% for As(V)...
...Also, Boo et al.(19) used diisopropylamine (DiPA) as a solvent for temperature swing solvent extraction (TSSE) for zero liquid discharge, and they found that DiPA is a potential candidate for extracting water from high-salinity brines, with total dissolved solids as high as ?292 g/L.
Reference 19 is this one: Zero Liquid Discharge of Ultrahigh-Salinity Brines with Temperature Swing Solvent Extraction (Chanhee Boo, Ian H. Billinge, Xi Chen, Kinnari M. Shah, and Ngai Yin Yip Environmental Science & Technology 2020 54 (14), 9124-9131) I looked at my notes from when I reviewed this issue of this journal - I review the Table of Contents of every issue of it - and I seem not to have noted this paper. I can be such a slob at times.
Despite the "foreign sounding" names of the scientist authors of this paper, reference 19 - all of whom are vastly more intelligent than redneck anti-immigrant morons like Ted Cruz, Josh Hawley, Ron Johnson and their fans in the White Supremacy Party - they are at Columbia University in New York, although they discuss environmental policy in China. Smug Americans, who like to brag about "being green," like to make fun of environmental policies in China, although their law on brine discharge may be compared with American laws on Brine discharge from fracking operations which basically don't exist:
I have added the bold.
About the moderate operating temperatures (40–60 °C) mentioned in the excerpt from the introduction of the paper under discussion, low temperature desalination plants do operate and have done so for a long time: The process is called MED, "Multieffect Distillation" which can, and sometimes do run on waste heat. Some have operated in places like the US Virgin Islands since before the close of the 20th century. (I'm a big fan of heat networks.) However these are not ZLD, zero liquid discharge plants. They discharge concentrated brine. A working figure for the salt content of seawater, without appeal to the sophisticated standards by which TEOS-10 operates, is 35 grams of salt per liter. The brine extracted in the Boo paper cited immediately above, contained 292 g/l, 8 times as salty as seawater. Brine this concentrated is an environmental hazard.
This differentiates the solvent extraction process from MED processes.
The paper cited at the outset of this boring post is a computer modeling paper:
Figure 1:
The caption:
...Two different system configurations are modeled in our investigation: (a) bulk phase solvents, used to calculate solvation free energy, and (b) binary systems (solvent–brine), used to quantify interfacial behavior. In order to create the binary systems, the solvent molecules (DiPA and TPA) are first placed in a rectangular box of 2.5 × 5 × 5 nm3 with periodic boundary conditions, followed by an equilibration stage. Then, these pre-equilibrated systems are combined to build the interfacial simulations. The biphasic system is built by placing the equilibrated organic solvent next to an equilibrated brine phase (with various salt concentrations) within a simulation box of 5 × 5 × 5 nm3. A vacuum slab is added in the z-direction. The vacuum in the system provides a single solvent–brine interface. This is to avoid the presence of two solvent interfaces interacting with the brine phase, which might elevate the water extraction. Because the temperatures explored in the simulation are well below the normal boiling points of the solvents and water, the species density in the vacuum region remains very low...
...and so on...
OK then, let's just look at the pictures:

The caption:
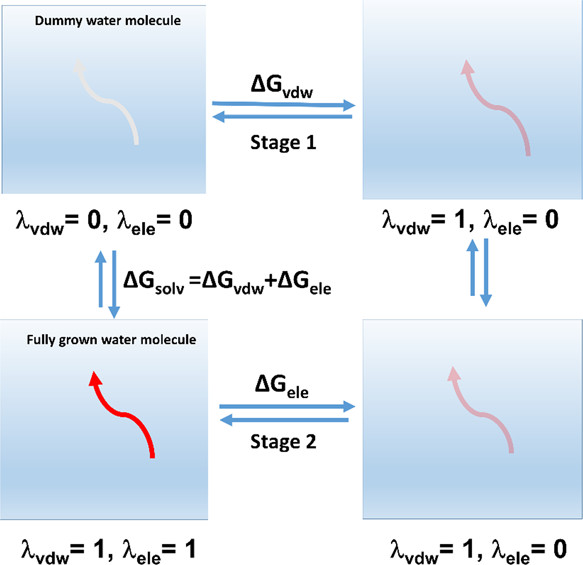
The caption:

The caption:
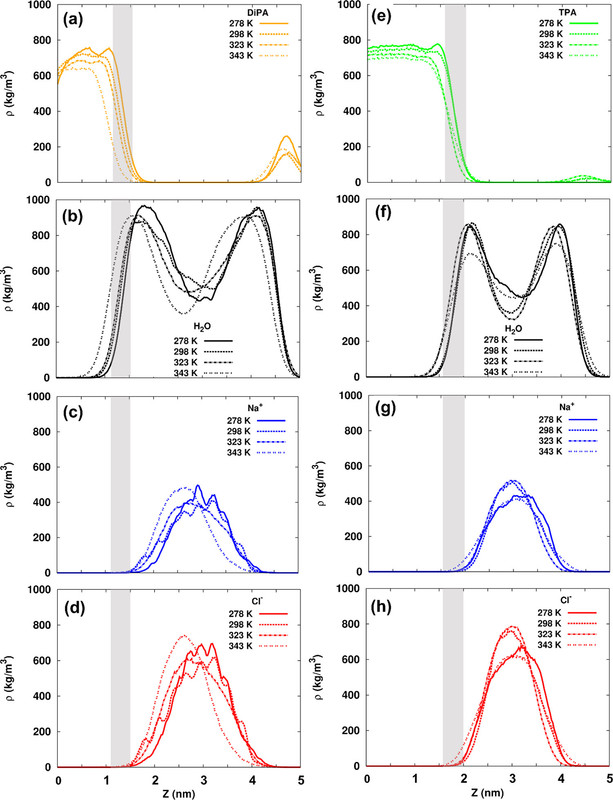
The caption:
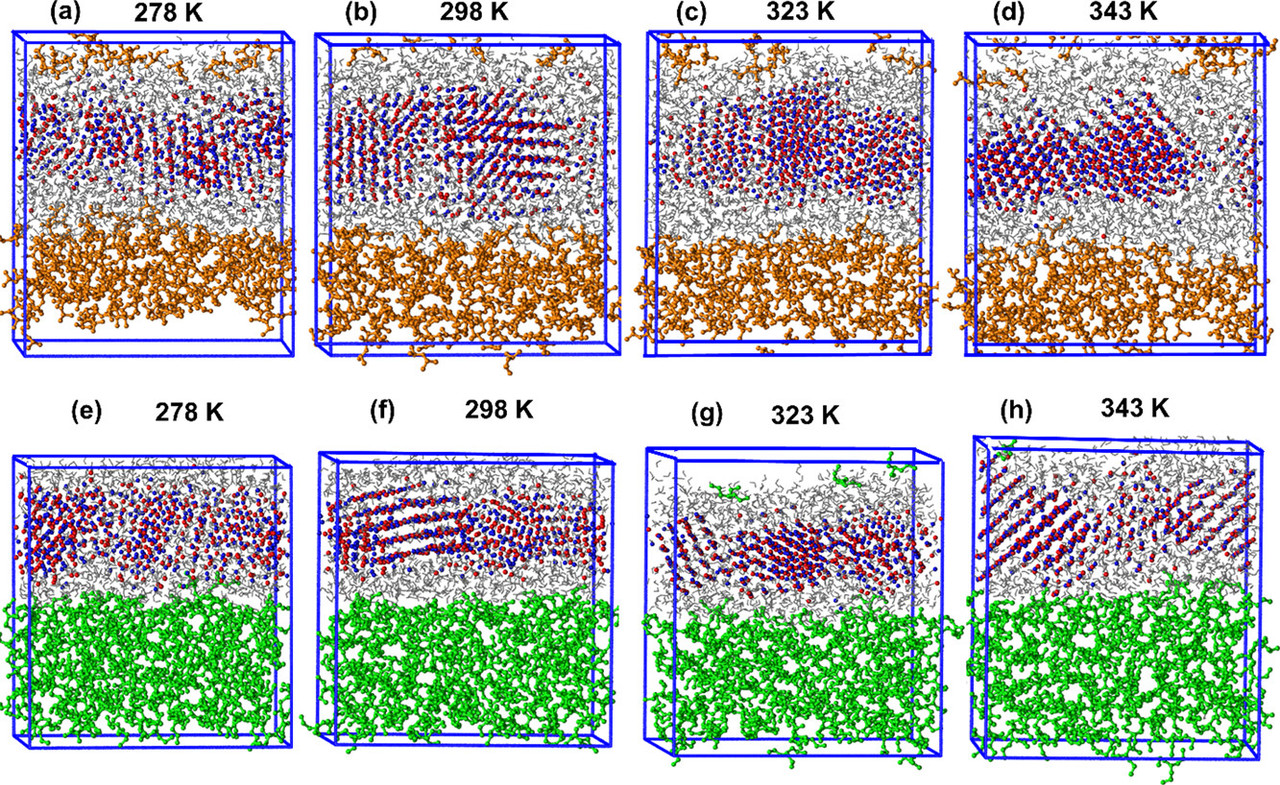
The caption:
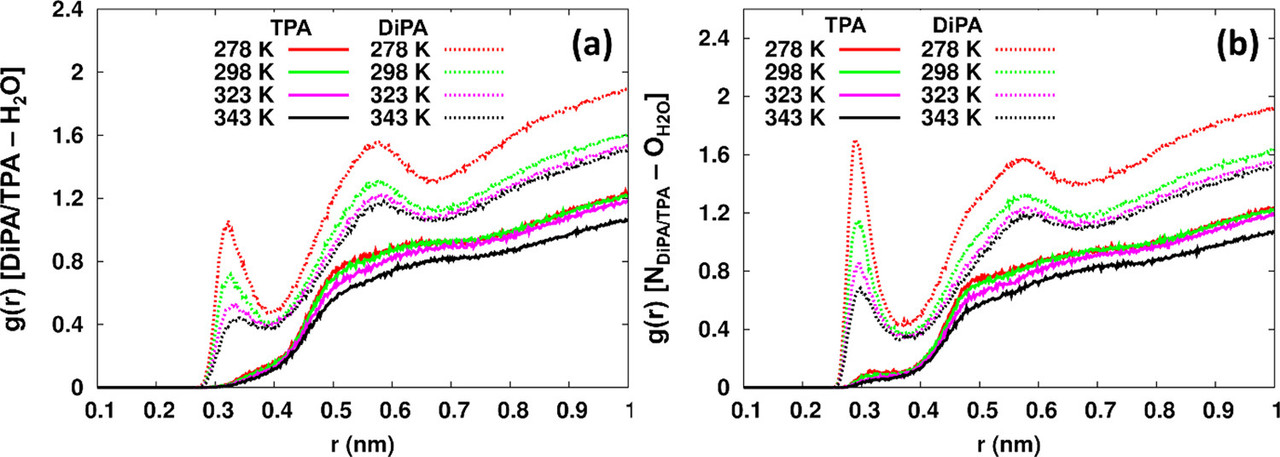
The caption:
RDF = "radial distribution function."
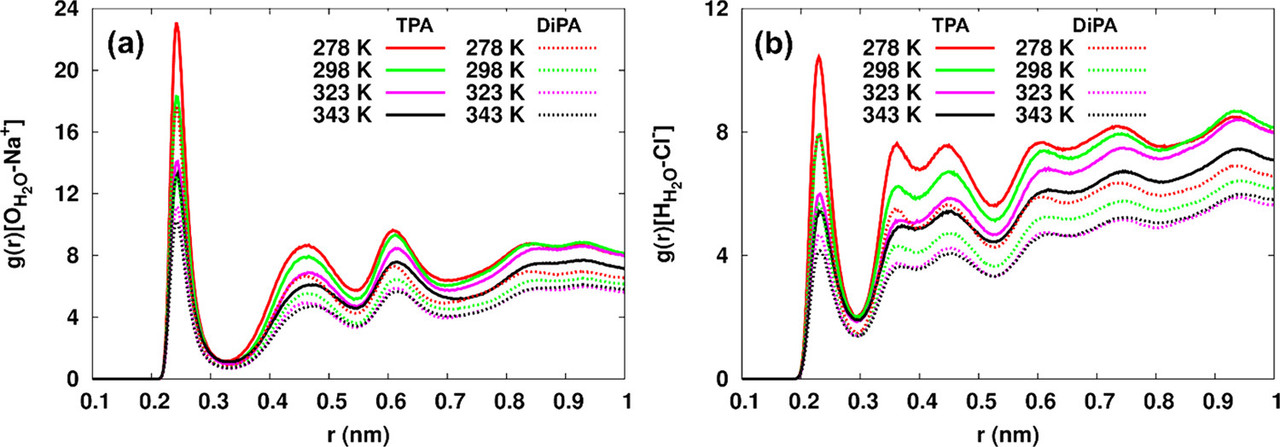
The caption:
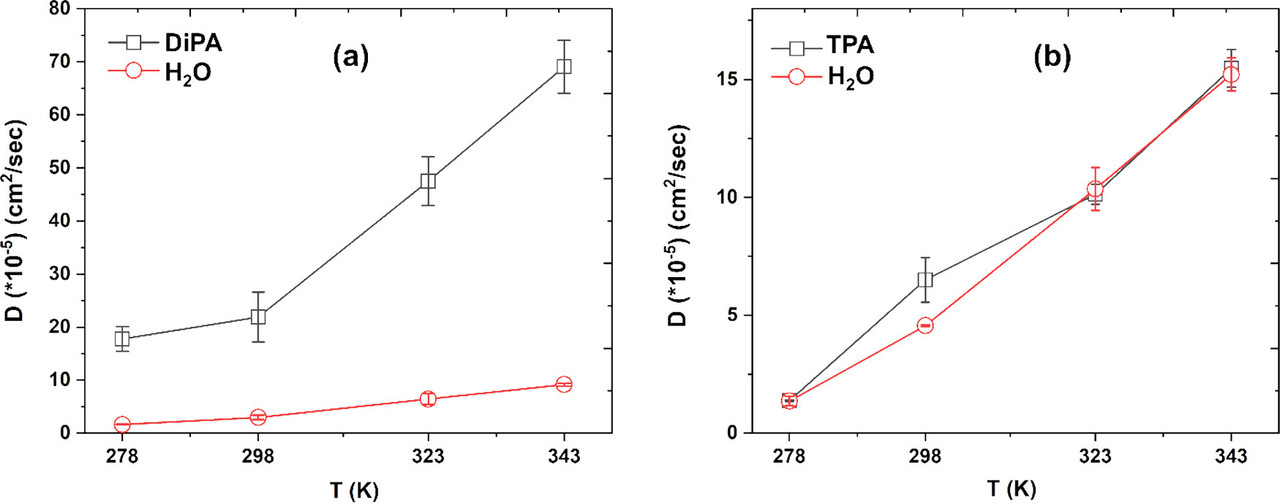
The caption:

The caption:
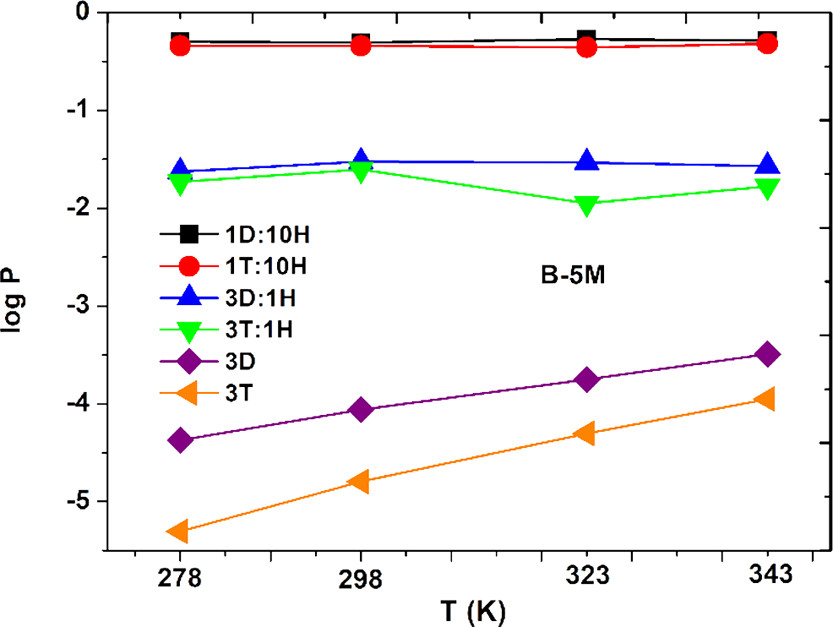
The caption:
From the conclusion:
To answer the question of "why don't we just..."
Well, there's a lot between here and there. Alkylamines smell bad, a fishy smell. Removal of residual amines from water obtained would almost certainly involve passing air through them. Our air is dirty because too many of us engage the very stupid rationale that "nuclear energy is too dangerous," and among the constituents of air pollution are the nitrogen oxides NO and NO2. Reacting with secondary amines like DPA will generate nitrosamines, many of which are potent carcinogens - dipropylnitroamine is already classified as a "suspect carcinogen." The synthetic route to alkylamines currently involves the use of dangerous fossil fuels, and the overwhelming majority of heat on this planet is generated by the combustion of dangerous fossil fuels.
If we were actually serious about phasing out dangerous fossil fuels - and very clearly we're not - we'd need to retrofit plants that we plan to close with extraction devices and heat exchangers.
In a rational world where we "went nuclear" quite literally to fight climate change - in my view the only technology with even a slim shot at addressing climate change - very high temperature nuclear reactors would be amenable to supercritical water desalination, with the added advantage of destroying microplastics in seawater, and extracting carbon dioxide from seawater. (However an SED process would make these desalination routes "ZLD" and prevent the discharge of concentrated brines into seawater.)
It is worth noting that TPA/DPA systems are certainly not the only option for SED processes featuring ZLD, something the authors note at the end of their conclusion:
These models can guide the separation of water from high-salinity brines using TSSE. Further simulations and experiments are currently underway to more broadly explore the design of task-specific amine- and imidazole-based solvents for brine treatment.
There are many good reasons for the use of imidazole based solvents, but that's a topic in an entirely different area.
This esoteric paper was a bit of a mind expander for me, and I enjoyed reading it and writing about it.
I trust your weekend will be as pleasant as mine has been thus far.
Gambling on Innovation
The paper to which I'll point, because it's, um, "different" is this one: Gambling on Innovation (Darrell Velegol Industrial & Engineering Chemistry Research 2021 60 (20), 7689-7699)
I love Hillary Clinton. I think she would have been an outstanding President of the United States, and the majority of Americans agreed with me that she should have had to opportunity to have served her country in this capacity. Of course I enthusiastically voted for her to become President and was astounded when she did not accede to the office that the clear majority of Americans chose her to assume. A residual clause in the US Constitution connected to human slavery, the Electoral College, prevented this, of course. It is entirely possible that this clause will have led to the complete destruction of that more than two century old system of government. Instead an racist corrupt ignoramus was seated in the office, doing great damage to our country, as this awful excuse for a human being is an "anti-Midas," inasmuch as everything he touches turns to shit. The race related clauses of the Constitution may yet succeed at killing it.
Nevertheless, no matter how much I liked her, even as early as 2008, during her first Presidential primary run against Barack Obama, I was very annoyed even back then when she made a statement, if I recall correctly that the solution to climate change was to "fund more research into 'renewable energy.'"
In the week beginning June 1, 2008, the concentration of the dangerous fossil fuel waste carbon dioxide in the planetary atmosphere, as measured at the Mauna Loa Observatory was 388.59 ppm.
Of course we have bet the planetary atmosphere on "more research into renewable energy." You cannot open very many scientific journals concerned with energy and the environment, particularly with respect to climate change, without coming across scores of articles detailing funded research into so called "renewable energy."
Here from the Mauna Loa Observatory is the data for the last 5 days for concentrations of the dangerous fossil fuel waste carbon dioxide in the planetary atmosphere:
June 01: 417.04 ppm
May 31: 419.90 ppm
May 30: 419.97 ppm
May 29: Unavailable
May 28: 420.65 ppm
Last Updated: June 2, 2021
Recent Daily Average Mauna Loa CO2 (Accessed 6/2/21 9:11 pm EDT)
The average of these numbers works out to 419.39 ppm, which is almost 31 ppm higher than it was around the time, June of 2008, I somewhat recall Ms. Rodham Clinton suggested we could save the world with "more research" into so called "renewable energy."
We didn't save the world, not that this has stopped "more research" into so called "renewable energy."
...well funded ]research...
...massively funded research.
For most of my adult life, the advocates of so called "renewable energy" have expressed little or no concern for eliminating dangerous fossil fuels, although dunderheads sometimes comment weakly and insipidly that this statement represents a (gasp) "straw man." They are against fossil fuels, they claim, although they express nowhere near as much angst here or elsewhere in connection with the seven million air pollution deaths that take each year as they do when, say, a tunnel collapses at a nuclear weapons plant.
We have bet the planetary atmosphere on the proposition that nuclear energy is "too dangerous," even though the worst possible case - which can be engineered away just as we engineer away the causes of aircraft crashes which have killed way more people than nuclear energy has - was established when an RBMK type nuclear reactor exploded in what is now Ukraine in 1986. It burned for weeks, and much of the inventory of its volatile fission products was released into the atmosphere, with results nowhere near as dire as the roughly 240 million people who have died from air pollution since 1986.
Air pollution isn't "too dangerous" in this calculation. Climate change isn't "too dangerous" in this calculation. Only nuclear energy is "too dangerous."
It would be better if we thought more about our betting, which is what this interesting paper is all about. From the introduction:
The allocation of innovation resources is an essential decision for chemical research to reach fruition and is part of the process design for innovation processes. A common approach is to base the allocation on the estimated net present value (NPV) and/or internal rate of return (IRR) or similar commonly used measures for the projects. One estimates the investment required over time and the revenue expected over time, discounts these back to the present-day value (e.g., with the cost of equity, CoE, as the discount rate), and takes the difference. If NPV greater than 0 with IRR greater than CoE, the project is a “yes” and otherwise a “no”. However, this approach suffers from three important challenges. (1) Not every innovation project results in a success, perhaps failing at the R&D level, the commercial level, the regulatory level, or others. Not all companies estimate a “probability of success” for their payoffs, which can be disastrous. It is like playing blackjack without knowing the odds. As this article shows, it is essential to have an estimate of the probability of success. For early-stage innovation, oftentimes p less than 50%. (2) The NPV–IRR style approach still does not indicate what fraction of our initial innovation bankroll we should invest in each project. In the extreme, should we simply pick out one, two, or three highest NPV projects and put all our investment there? Or as many as we can afford until we have spent out? Or some other strategy? (3) As we will see in this article, the NPV or IRR types of “arithmetic average” approaches inevitably lead to “going bust” over time. Your company might still limp along, like an engineer who loses every weekend at the casino but remains solvent due to a steady income, but the innovation gambles that you are making are losing money, or they are at the least inferior to what they could be.
The core concept behind this article is a method familiar to the investing and gambling communities, the Kelly criterion (KC). In 1956, shortly after Claude Shannon had published his famous article on information theory,(1) Kelly sought to use the ideas of information theory to improve performance in games of chance. He wanted to find the maximum growth rate in total wealth for a gambler with a private but potentially noisy wire of information. As Kelly stated in his article, “The maximum exponential rate of growth of the gambler’s capital is equal to the rate of transmission of [Shannon] information over the channel.”
In fact, we might see the role of a company’s innovation team (including R&D, as well as commercial leadership, marketing, manufacturing, legal, finance, regulatory, safety, and other functions) as providing information that reduces the risk (i.e., probability of a non-success) of an innovation idea failing somewhere in the process. There are systematic methods for reducing this risk and increasing the speed of innovation.(2,3) In the academic world, one usually publishes an article only with a high probability—perhaps greater than 99% or even 99.9%–—that the work is correct. However, attaining a 1.0 or 0.1% probability of failure (risk) is very expensive in terms of time and money, and in a competitive marketplace, a manager needs to know how to allocate investments in part to avoid being scooped. It is well-known in the investing world that asset allocation is among the most important factors of success, that is, choosing when to pull money from one class of investment and put the money elsewhere including even cash. In this article, I provide a quantitative method for doing this with innovation investments, and as we will see in Section 6, the method can be extended to a broad range of activities.
To introduce the concept, let us explore an example, which will provide some intuition on how to place our bets on innovation projects. Let us say that I enter a coin flipping game at a casino. The casino lets me use a coin from my own pocket, which I believe is unbiased, such that the probability (p) of heads is 0.5 and tails is 0.5. In this game, if heads comes up, my payoff odds are given as 1.5 (i.e., if I bet $1 and win, I increase to have $1 + $1.5 = $2.5; so here I define a payoff ratio b = 1.5), and if tails comes up, I lose my bet (i.e., if I bet $1 and lose, I now have $1 less; I define a loss ratio a = 1). The casino offers me the opportunity to make 1000 flips, and if I start, I must finish all 1000 flips or forfeit any winnings. If I start with $100, how much should I bet each round? The bet is clearly biased in my favor, as the casino knows; however, there must be some reason why they offered the bet. Wanting to maximize my wealth at the end of the 1000 bets, I don’t want to squander my advantage. So should I bet it all? Before I do so, thankfully I recognize that putting “all my eggs in one basket” is probably not wise either. Note that this game is not an ergodic process. Placing 1000 simultaneous bets at one time period is much different from placing 1000 bets consecutively and independently.
We can simulate the result. What happens if I bet 34% each round? Starting with $100, I’ll bet $34 on the first flip. If I win, I now have $100 + $34 × 1.5 = $151. On the second round, I would bet 34% of my new amount, or $51.34. If I continue this pattern for all 1000 flips, then simulations show that my median outcome would be about $18 left after 1000 flips, and I would in fact go bust (“ruin”, where I reach less than $1) about 41% of the time. Aha! That’s why the casino made me this generous offer! And if I were to bet 50% each time, I would go bust greater than 99.9% of the time, and my median final wealth would be $0. That is, by betting 34 or 50%, I’m putting “too many eggs in one basket”, again even though I have the clear advantage in the betting. My arithmetic average outcome will be even higher but only because some rare runs make it so; in fact, my median outcome is awful in these cases. This is the reason why financial investors use a portfolio of (hopefully independent) investments rather than putting the entire investment into equities for instance.
If, by contrast, I were to bet at half of the previous rate, or 17% of my capital each round, my median take home amount after 1000 bets would be about $72 B, and I would go bust ( less than $1) with a probability of less than 0.0065% (i.e., once every 154,000 trips to the casino, or almost never). How could I possibly know to bet “so little” to win so much? This is the problem that Kelly solved in 1956.(4) The Kelly criterion in eq 1 below, derived in Supporting Information Section A, in fact gives fKC = 0.1667. Plugging in p = 0.50 (probability of winning) and q = 1 – p = 0.5 (probability of losing), with b = 1.5 and a = 1 gives f = 0.1667. By maximizing the growth rate of the total wealth, he established what is now known as the KC for the fraction of your wealth (fKC) to gamble in a binary (win–lose) bet

Some additional text:
1. Allocation of bets. What fraction of my initial innovation bankroll (W0) should I bet on each of my potential innovation projects? Which bets should I avoid entirely?
2. Quantiles of the compound annual growth rate (CAGR). If I have a set of bets, each with a binary success probability (p) of payoff (b) and a probability of loss (q = 1 – p) of amount (a), what is the anticipated median CAGR? Is it greater than the cost of equity (CoE)?
3. ruin rate. How often will I “go bust”? We could choose any fraction to define “ruin”, but here, we will define “ruin” as losing 99% of your initial investment. Your company might still feed a bad innovation process, keeping it afloat, but the portfolio selection might make it a loser.
4. Algorithm and heuristics. Is there a simple and practical algorithm that I can use to allocate my portfolio of bets? Are there guiding heuristics that I can use in the absence of more detailed knowledge?
Despite its advantages, there are two well-recognized shortcomings of betting according to the KC.(7) (1) Finding good bets. This article provides a method for evaluating known opportunities, but it does not provide a route for identifying or generating new opportunities.(3) (2) A relatively high early allocation. While it is true that the KC maximizes your long-term growth rate, the initial allocation is still volatile, and so, many investors or gamblers avoid going bust early by using a “fractional Kelly bet”, often half. I point out that there are critics of the KC for investing, perhaps most notably, the late Nobel laureate Paul Samuelson.(8) His primary critique was that maximizing the growth rate is equivalent to maximizing a logarithmic utility function, but that there are other utility functions. Ziemba wrote a helpful article,(9) not disputing Samuelson as much as showing how his arguments sharpen the theory and its effectiveness...
A graphic from the paper:
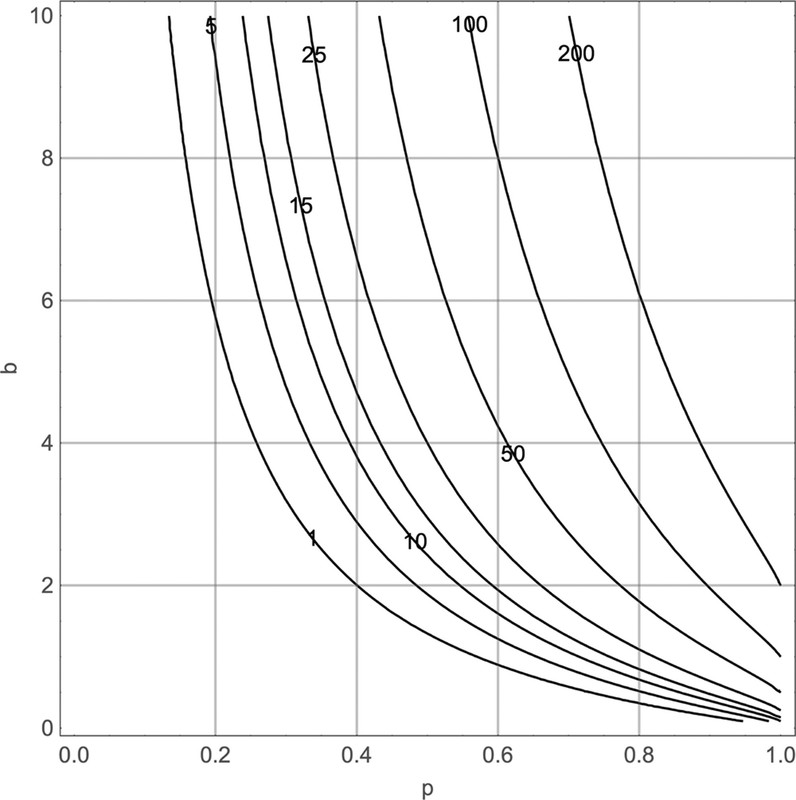
The caption:
There is some mathematical discussion in the paper about the "ruin rate," the third item in the list above, "going bust."
Here's what I would call "going bust:"
In the year 2000, for the week beginning May 28, 2000, the 12 month running average of comparison with the CO2 concentrations in a particular week with the concentrations for the same week ten years before was 15.08 ppm higher, or 1.51 ppm/year. In 2021, for the week beginning May 23, 2021, that value was 24.43 ppm or 2.44 ppm per year.
We've gone bust.
It was a wild bet. History will not forgive us for making it, nor should it.
It's a fun paper. If you have a chance to access it, I recommend it.
Have a nice day tomorrow.
Profile Information
Gender: MaleCurrent location: New Jersey
Member since: 2002
Number of posts: 33,587