NNadir
NNadir's JournalA dead battery dilemma
The Science news item I'll discuss in this post is this one: A dead battery dilemma Ian Morse, Science 21 May 2021: Vol. 372, Issue 6544, pp. 780-783.
Subtitle: With millions of electric vehicles set to hit the road, scientists are seeking better battery recycling methods.
Ian Morse, the author of this news item, despite publishing a news article in one of the world's most prestigious general scientific journals is not, apparently, a scientist. He is a journalist, which explains why he has utilized a misleading subtitle, since it implies that batteries are currently recycled. Currently they largely are not; as is explained by the caption to the first picture in the news article.
The picture in question:

The caption:
Cheaper for whom? For us, or for future generations, about whom, apparently, we couldn't care less?
The news item is probably open sourced. I have accessed it without signing in to the journal. Here anyway, is an excerpt:
That's just one of the many problems confronting researchers, including Thompson, who are trying to tackle an emerging problem: how to recycle the millions of electric vehicle (EV) batteries that manufacturers expect to produce over the next few decades. Current EV batteries “are really not designed to be recycled,” says Thompson, a research fellow at the Faraday Institution, a research center focused on battery issues in the United Kingdom.
That wasn't much of a problem when EVs were rare. But now the technology is taking off. Several carmakers have said they plan to phase out combustion engines within a few decades, and industry analysts predict at least 145 million EVs will be on the road by 2030, up from just 11 million last year. “People are starting to realize this is an issue,” Thompson says.
"People are starting to realize..."
Might it not have been a better idea to have thought this issue through before declaring, as everyone everywhere does in an overly facile fashion, that batteries are "green," because they can store so called "renewable energy?"
Excuse me for being, um, difficult and raising difficult questions.
To my knowledge, there is one, and only one, new technology for which one of its inventors considered the sustainability and acceptance and risk issue before the industry was built: That would be nuclear energy. Among others, Enrico Fermi, who designed and built the first nuclear reactor under a squash court in Chicago, wondered if the public would accept the accumulation of radioactive fission products if nuclear reactors went commercial. This consideration did not stop Enrico Fermi from designing and building nuclear reactors: He advocated for the first nuclear reactor ever to be utilized to generate an electric current. It produced enough electricity to light a small incandescent light bulb.
The long term storage of fission products, all of which I contend are extremely useful, or would be in a sane world as opposed to the world in which we actually live, has resulted in an extraordinarily low death toll, lower than the death toll associated with explosions buildings utilizing dangerous natural gas, and a huge order of magnitude lower with the death toll associated with the inability to contain dangerous fossil fuel waste and dangerous combustion waste from "renewable" biomass:
It is still not clear, 70 years later, whether the public "accepts" the accumulation of fission products, although a few thousand metric tons of fission products have been created. The public however accepts billions of tons of dangerous fossil fuel waste, which kills approximately seven million people per year, not counting climate change, which causes hundreds of billions of dollars of damage in ever more regular "extreme" weather events, albeit that such weather events are not really "extreme" any more.
The scientific literature is filled, absolutely filled, with oodles and oodles of discussions of the issue of recycling batteries. The current issue of one of the journals I regularly read, ACS Sustainable Chemistry and Engineering, which I just went through tonight, has two articles on approaches to recycling batteries, including this one: Strengthening Valuable Metal Recovery from Spent Lithium-Ion Batteries by Environmentally Friendly Reductive Thermal Treatment and Electrochemical Leaching, (Shuya Lei, Yintao Zhang, Shaole Song, Rui Xu, Wei Sun, Shengming Xu, and Yue Yang, ACS Sustainable Chemistry & Engineering 2021 9 (20), 7053-7062)
Some fun text from that paper's introduction:
Well, there you have it. There is a shortage of resources for something generally described as supporting what is claimed to be "renewable."
By the way, a process that is electrochemical and/or a process that is thermal, by definition requires energy.. I never tire of pointing out that infrastructure that is both economically and environmentally superior to all other processes will be a continuous process.
Maybe we can get the necessary energy to recycle batteries by, um, burning them. Another picture and caption from the news item cited at the outset:

The caption:
It's widely experienced, if swept under the rug with other unpleasant things we don't wish to ponder, that the wind doesn't always blow and the sun doesn't always shine. This is true even in renewable energy nirvanas like California, where wind and solar droughts are not just possible, but are known.
The recommended solution: Mine more copper to make more copper wires.
It's an issue in Germany as well, and they have a word for it: Dunkelflaute.
Let's all depend on the weather, even while we destroy weather stability while we exercise all this popular enthusiasm for going "green."
"Green."
The issue of the availability of mass goes beyond batteries of course.
Here's an editorial from another scientific journal, Nature Reviews Materials: Raw materials for a truly green future It was published this month. “People are starting to realize this is an issue...”
Some text from the editorial:
The link to the popular automotive press occurs in the original editorial.
Another link appears in the editorial which I will produce outside of it.
Mining our green future (Comment, Richard Herrington, Nature Reviews Materials, published 24 May 2021.)
Some text:
"Green technologies..."
I would consider the title of this comment to be an abuse of language. Is it not inherently true that any technology, that depends on vast mining of readily depleted resources is not green?
Go figure.
We live in the age of the "big lie." Reality, even obvious reality, no longer matters.
“People are starting to realize this is an issue...”
We hit 420 ppm concentrations of the dangerous fossil fuel waste carbon dioxide in the planetary atmosphere, well less than ten years after we first hit 400 ppm.
History will not forgive us, nor should it.
Have a wonderful Memorial Day weekend.
Edited for typos.
A 10 per cent increase in global land evapotranspiration from 2003 to 2019
The paper I'll discuss in this post is this one: Pascolini-Campbell, M., Reager, J.T., Chandanpurkar, H.A. et al. A 10 per cent increase in global land evapotranspiration from 2003 to 2019. Nature 593, 543–547 (2021).
I have to make a guilty confession that back in the 1970's, when I was a young man, I used to take seriously articles about "studies" which "showed" that the world "could" run on "100% renewable energy" "by 1995" and then "by 2000," then "by 2010," then "by 2020." Now, I read about "by 2050," or "by 2040," even. Of course, I know longer take these prayerful chants seriously, since at least later in my life, I took it upon myself to seriously look at reality.
Reality consists of facts. Facts matter.
That huge powerful so called "renewable energy" device, the Hoover dam, holds back an artificial lake, Lake Mead.
Here is a compilation of the elevation of Lake Mead's surface, going back to the beginning of the reservoir's filling, beginning in 1935, thus destroying and strangling the Colorado River Delta ecosystem in Mexico: LAKE MEAD AT HOOVER DAM, END OF MONTH ELEVATION (FEET)
Since 1935, Lake Mead has been lower than 1080 feet at the end of any month, as it was at the end of April 2021, 61 times. Twenty eight of those times were recorded in the 1930's, while the "lake" was filling. The other 33 times have all taken place since April of 2015.
Lake Mead first reached an elevation of 1200 feet in 1941. The highest elevation ever recorded 1225.44 feet, was in July of 1983. The lowest ever recorded was 1071.64, recorded in July of 2016.
Anyone want to take any bets on whether there will be a new record low in 2021?
They're not taking bets over at CNN: First-ever Colorado River water shortage is now almost certain, new projections show
The US Bureau of Reclamation (USBR) forecasts the lake's levels to continue to decline, without any sign of recovery through at least the end of 2022.
Don't worry. Be happy. 100% "renewable energy" by...by...by...by...whatever.
Until the Godotian "renewable energy nirvana" breaks out, I wouldn't advise investing in Golf Courses in the Phoenix area, for that matter, in Las Vegas, or the LA area.
The global water cycle is severely disturbed. I personally attribute this fact - facts matter - to the mentality that states "nuclear energy is 'too dangerous.'" Climate change isn't "too dangerous," however, apparently, to the people proudly wearing this mentality. Also I hear "nuclear energy is 'too expensive.'" Drying out the entire western United States is not "too expensive," however.
Of course, I'm nowhere near as smart or as famous as say, Robert F. Kennedy, who is anti-nuke, anti-dam, anti-wind, anti-fossil fuels, anti-vax, anti-GMO, anti-this, anti-that. Of course, like most people born into wealth he did nothing to earn, he is decidedly not anti-poverty. He couldn't care less about people living in sun baked mud huts burning sticks and dung to cook their food, with no access to even primitive improved sanitation, people compelled to defecate in the open because well, Robert F. Kennedy Jr. thinks that vaccines, nuclear power plants, dams, etc. are "too dangerous." Children dying from diarrheal diseases because of a lack of sanitation, clean water, and energy, or for that matter from the lack of access to a vaccine, is not "too dangerous."
By the way, Robert F. Kennedy Jr. - as one can see in the first link involving him above - is suing Daily Kos, and although I have no use for Daily Kos, I certainly support Markos's efforts to prevail against Kennedy's case, which is about anonymity on blogs. It doesn't merely affect Kos; it affects all of us. So let's wish Markos "good luck!."
Markos banned me from Daily Kos after I cited a paper by the climate scientist who used to be a hero at Daily Kos, until he wasn't, Jim Hansen. The paper was this one, which I still cite often, as I find the statements, facts and conclusions therein irrefutable:
Prevented Mortality and Greenhouse Gas Emissions from Historical and Projected Nuclear Power (Pushker A. Kharecha* and James E. Hansen Environ. Sci. Technol., 2013, 47 (9), pp 4889–4895)
After citing the paper, I remarked, in crude language that I will only paraphrase as I've mellowed in the years since I was invited to leave Kos, that if what Jim Hansen wrote in the paper is true - and I contend it is true - then opposing nuclear energy is murder.
This, I'm sure, was and is a true statement.
Facts matter.
It's not like I claimed that the events January 6, 2021 at the US capitol involved excited tourists.
Go figure.
One anti-science anti-nuke suing another. It doesn't get any better than that, although, frankly, it's a little obscene, under the circumstances, to engage in Schadenfreude. We are all, every human being on the planet, suffering from the result. If it were possible that a reactionary return to so called "renewable energy" could save the world, if it had saved the world, no reasonable person could have objected.
But it didn't save the world. It isn't saving the world. It won't save the world.
But my small whiny personal concerns are trivial; in the not too distant future, certainly "by 2050," I will have "shuffled off this mortal coil," as Willie the Shake so eloquently put it. I will say though, that we on the left need to "think anew," about energy. Our thinking on the left has exactly the same result as what passes for "thinking" on the right:
The global water cycle is changing rapidly and the consequences are very real.
From the introduction to the paper:
Previous studies have shown that the estimation of continental to global ET is quite challenging, and it is likely that this flux still represents the most uncertain term in the global water budget. The lack of an observational constraint on global land ET makes it difficult to evaluate the trends and drivers of global ET calculated from different methodologies (Extended Data Table 1). Using eddy covariance observations and machine learning, a study found that global ET increased between 1982 and 1998, but then decreased from 1998 to 2008 due to limited water supply19. Other studies have also found evidence of increasing ET in recent decades: a study using the Global Land Evaporation: the Amsterdam Methodology (GLEAM) model constrained by satellite observations detected a positive trend over 1980 to 2011, and found that decadal ET was dominated by natural variability associated with El Niño–Southern Oscillation (ENSO)20, whereas a different study also found a positive trend, but detected varying relationships among models and remote-sensing products with tropical Pacific variability21...
...Here we present a direct mass-balance (that is, top down) estimate of monthly global land ET based on Gravity Recovery and Climate Experiment (GRACE) and GRACE-Follow On (GRACE-FO) satellite observations13. At basin scales, the mass conservation equation requires discharge (Q) at the mouth, total Pr over the basin and basin water storage change to calculate ET as a residual. With GRACE providing the water storage changes, water budget estimates of ET have proven effective in providing independent constraints regionally24,25,26,27,28,29 and globally30,31. In previous work, we applied this method to evaluate ET products for major basins in the continental United States, and found that even aggregating at the basin scale produced biases in remote-sensing and model-based methods compared with water-balance closure25.
At global scales, accurate knowledge of Q remains challenging given the sparsity of coastal stations32. However, this can be addressed by calculating global discharge with an ocean mass-balance approach33,34, and this study uses novel estimates of global Q that do not rely on gauges or models. The water-balance variables are entirely independent: the precipitation data are averaged over land areas, whereas the discharge estimates close the ocean mass balance using data exclusively from ocean areas...
Some images from the paper:
Fig. 1: Water-balance seasonal cycles.
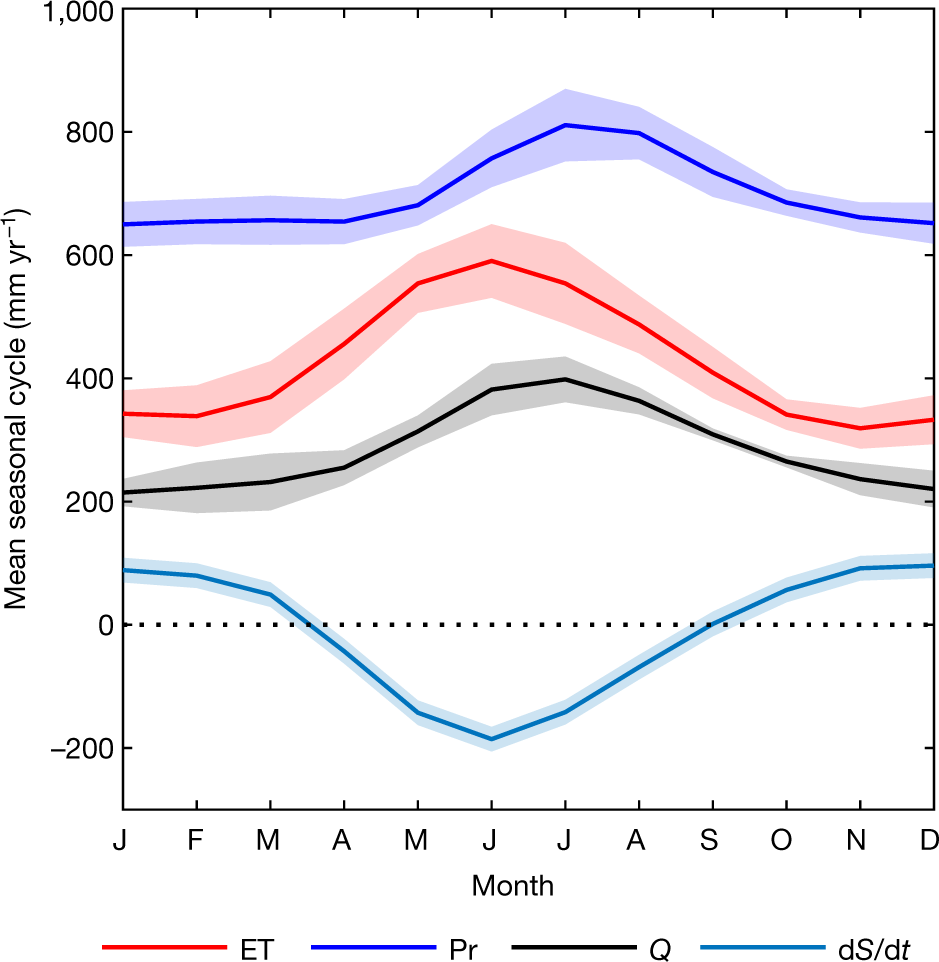
The caption:
As for what dS/dt is there's this text:
Fig. 2: Comparison of ET with other products.
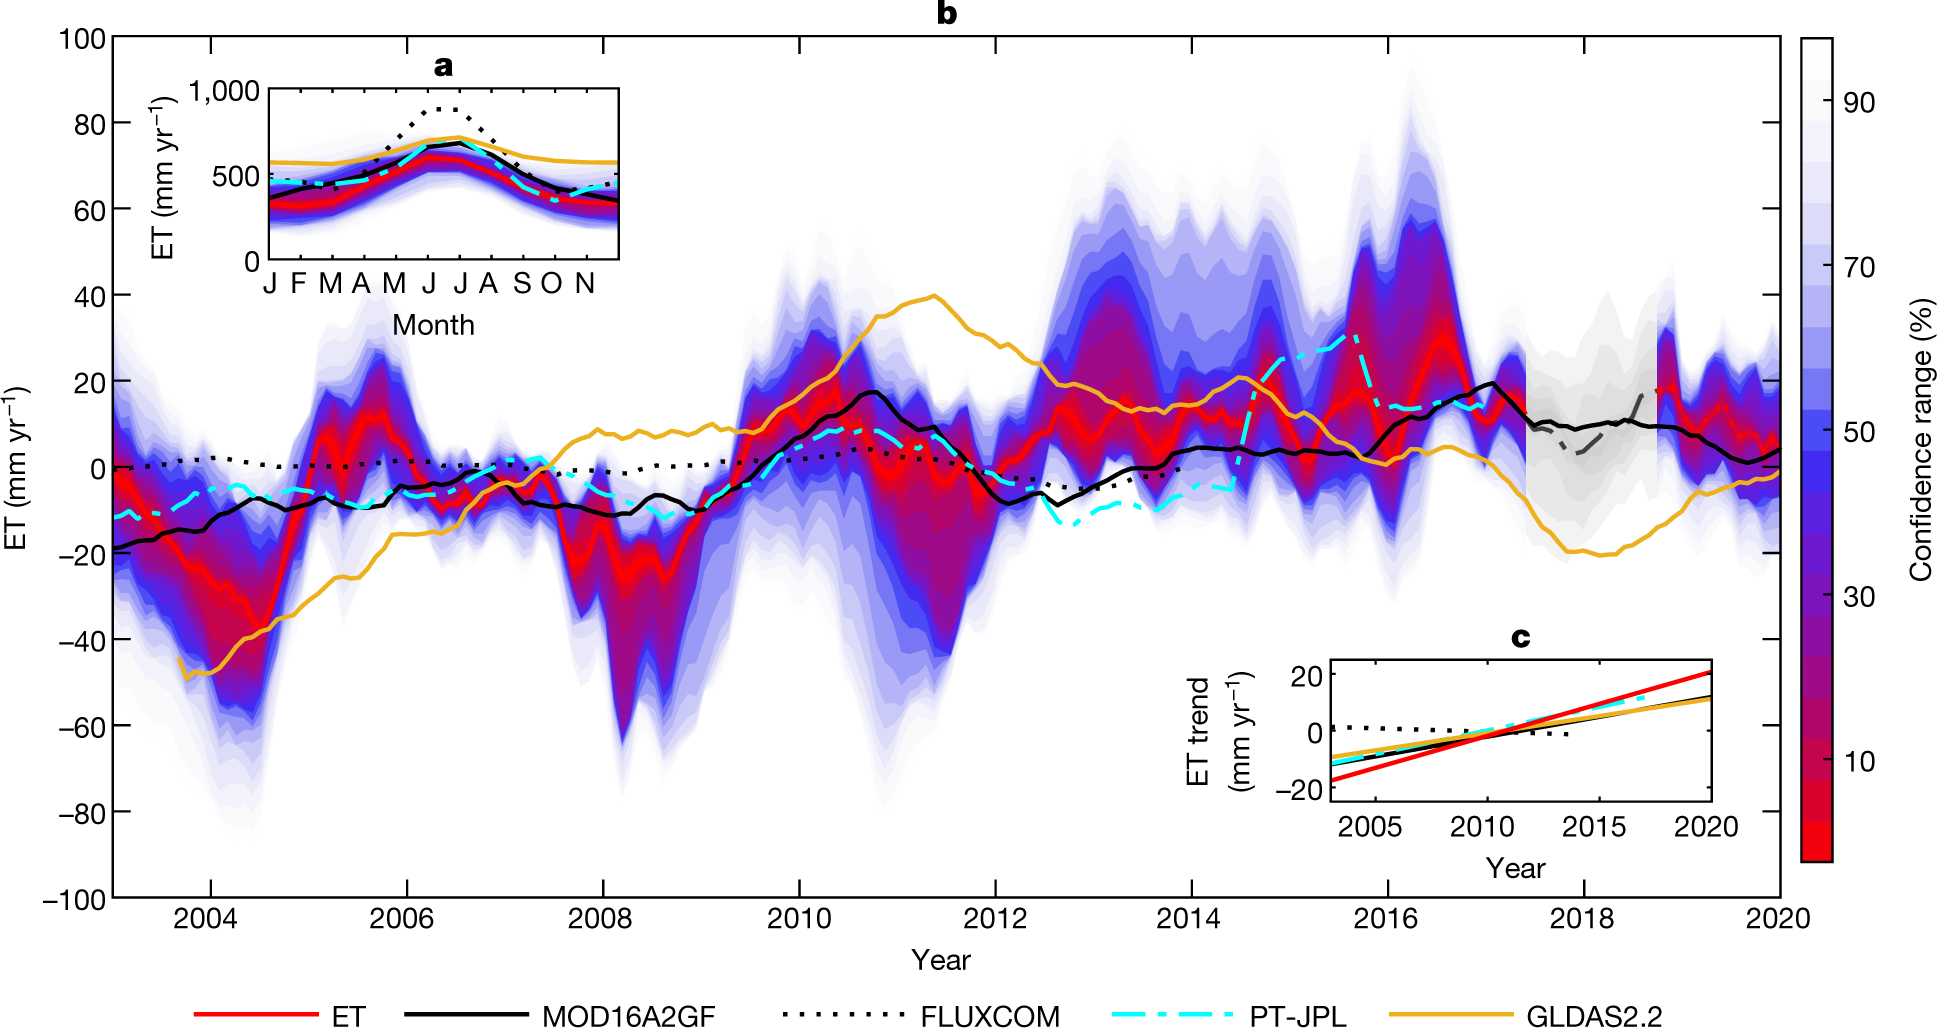
The caption:
Fig. 3: Trends in the water balance.
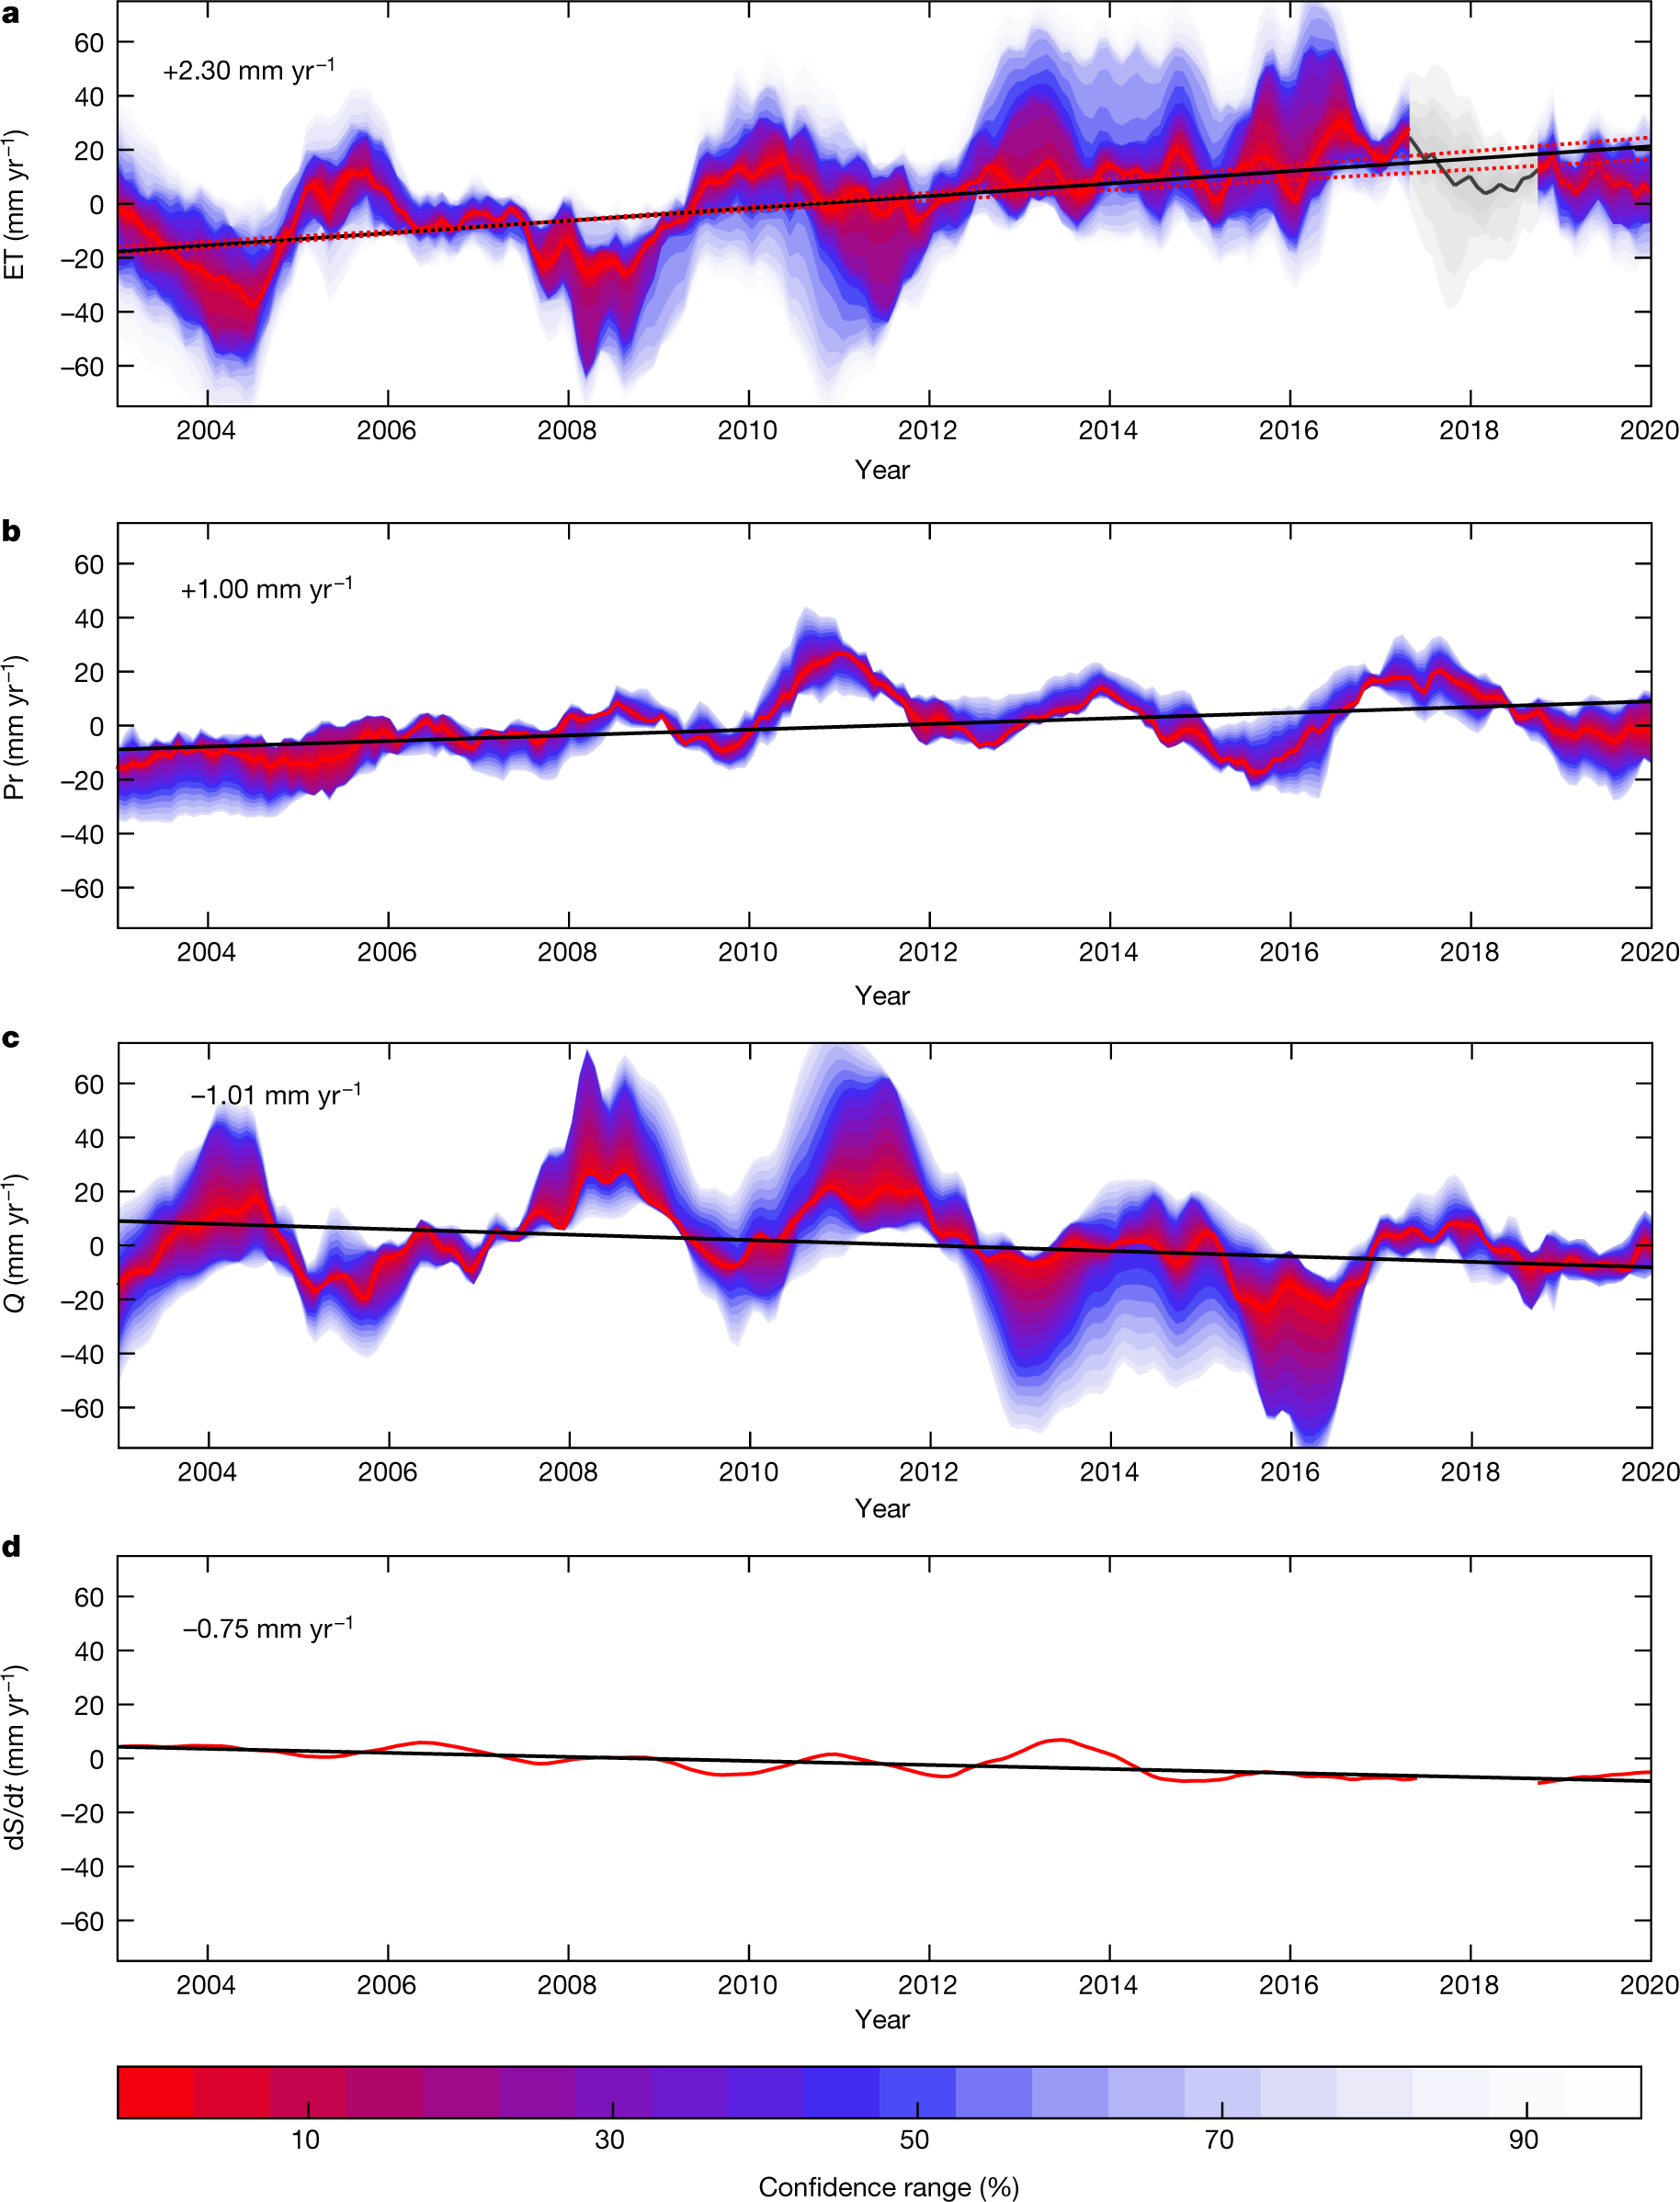
The caption:
Some additional text:
ET increased over 2003 to 2019 with a significant positive linear trend of 2.30 ± 0.52 mm yr?1, corresponding to an increase of approximately 10 ± 2% above the global mean ET. The trend is significant even in light of the gap filling and error of the input data. The positive trend results from the interaction of all water-balance components: a positive trend in Pr, coupled with negative trends in Q and dS/dt. Pr is also increasingly partitioned into ET and not Q, which has implications for water availability. The observed increase in ET is consistent with previous studies20,22,23.
A 10% increase in ET represents an increased loss of water from land with potential implications for water resources, climate and agriculture. Higher ET fluxes can also influence the land–atmosphere energy exchange and produce surface cooling from enhanced latent heat fluxes37. In the context of our results, which indicate that the positive ET trend is due to warming, this could create a negative feedback mechanism to counteract warming. We note that our global ET estimate is a bulk estimate, and therefore cannot highlight specific hotspots of global change, and future regionally based work is needed to identify regional variations.
On the basis of the present findings, there is more of an apparent effect of temperature rather than ENSO variability on the trend in ET. This finding is consistent with the premise that the water cycle will intensify in a warming climate due to greater atmospheric demand1. Global land surface temperature variability explains most of the variability in ET (54%), whereas natural climate variability associated with ENSO explains only 17%...
The conclusion of the paper is rather dire, but well...don't worry be happy.
"By 2050..."
I trust you will enjoy the Memorial Day weekend. It's going to rain most of the weekend in New Jersey, and that, I think, may be a good thing. I worry all the time about droughts, and it's not entirely an artifact of having once lived in Southern California.
Divisive COVID 'lab leak' debate prompts dire warnings from researchers
From Nature news: Divisive COVID ‘lab leak’ debate prompts dire warnings from researchers
Subtitle: Allegations that COVID escaped from a Chinese lab make it harder for nations to collaborate on ending the pandemic — and fuel online bullying, some scientists say.
Amy Maxmen, Nature NEWS 27 May 2021
It's probably open sourced.
Some excerpts:
Global-health researchers also warn that the growing demands are exacerbating tensions between the United States and China ahead of crucial meetings at which world leaders will make high-level decisions about how to curb the pandemic and prepare for future health emergencies. At the World Health Assembly this week, for example, health officials from nearly 200 countries are discussing strategies including ways to ramp up vaccine manufacturing and to reform the World Health Organization (WHO). But a US–China divide will make consensus on these issues harder to reach, says David Fidler, a global-health researcher at the Council on Foreign Relations, a think tank in Washington DC. “If there’s some turning down of the geopolitical heat between these two great powers, we could create some space to perhaps do some of the things that we need to do,” he says.
Others worry that the rhetoric around an alleged lab leak has grown so toxic that it’s fuelling online bullying of scientists and anti-Asian harassment in the United States, as well as offending researchers and authorities in China whose cooperation is needed.
Fever pitch
The debate over the lab-leak hypothesis has been rumbling since last year. But it has grown louder in the past month — even without strong supporting evidence. On 14 May, 18 researchers published a letter in Science1 arguing that the idea of the coronavirus SARS-CoV-2 leaking from a lab in China must be explored more deeply. It points out that the first phase of a COVID-19 origins investigation sponsored by the WHO, which released a report in March, focused more on the virus coming from an animal than on its potential escape from a lab. For example, the report mapped a large market in Wuhan, China, and stated that most samples of SARS-CoV-2 recovered there by investigators were found around stalls that sold animals. Many virologists say that this focus is warranted, because most emerging infectious diseases begin with a spillover from nature, as seen with HIV, Zika and Ebola. Genomic evidence also suggests that a virus similar to SARS-CoV-2 originated in horseshoe bats (Rhinolophus spp.), before spreading to an unknown animal that then passed the pathogen to people...
…Even if the letter in Science was well intentioned, its authors should have thought more about how it would feed into the divisive political environment surrounding this issue, says Angela Rasmussen, a virologist at the University of Saskatchewan in Saskatoon, Canada.
WHO report into COVID pandemic origins zeroes in on animal markets, not labs
The lead author of the letter, David Relman, a microbiologist at Stanford University in California, still feels it’s important to voice his opinion — and says he can’t stop it from being misrepresented. “I am not saying I believe the virus came from a laboratory,” he says. Rather, he says that the authors of the WHO investigation report were too decisive in their conclusions...
Once again the media obsessed with the murderer and not the victims.
I consider that many mass murderers thrive on the attention or the hope of posthumous attention, which is what they get.
What they deserve is obscurity.
Jacinda Ardern has it right.
Going to my son's LIVE graduation on Monday!!!!
He graduated early, in December, but stayed on for some graduate work, but the university, in light of the vaccinations, has decided to have a live graduation, parents and family, for his class. (There are no mid-year ceremonies.)
The 2020 graduates were not so lucky. We saw some poor young woman on cancer, in robes, last summer, standing alone with her parents for pictures.
I would like to thank the President of the United States for allowing this to happen.
A Predictive Biomarker Is Found to Measure the Effectiveness of SARS-Cov-2 Vaccines.
In this post I will briefly discuss a news item in Nature, this one: Scientists zero in on long-sought marker of COVID-vaccine efficacy
I will then point to the paper it references, which should be open sourced: Khoury, D.S., Cromer, D., Reynaldi, A. et al. Neutralizing antibody levels are highly predictive of immune protection from symptomatic SARS-CoV-2 infection. Nat Med (2021).
Subtitle: Data from seven vaccination trials help to identify a blood marker for protection against the disease.
A biomarker, (or blood marker) for those who do not know, is a chemical found in tissue - often but not always blood - that indicates the presence, absence, and in some cases, the probability of a disease state. Common examples of which most people are aware are glucose levels for diabetes, A1Ac for type 2 diabetes, cholesterol, for heart disease, troponin for heart attacks, so and so on...
The discovery of biomarkers is sometimes non-trivial, and often they depend of measuring patient outcomes in clinical trials (or in epidemiological studies) along with a "shotgun" series of measurements of multiple species in a data independent setting, in the mass spec case, or, infectious diseases ligand binding "sandwich" assays which utilize receptors displayed on the surface by the offending organism or viral particle, or degradants of the particle or organism (for example qPCR type RNA tests to detect Covid.)
There are many complications in measuring antibodies, since they are protein molecules with a large nearly invariant structure, having a Y shape, with the stem of the "Y," called the Fc region, being generally completely the same for differing antibodies with different functions. Their activity is determined by a small sequence of amino acids, called the "CDR" - the complementarity determining region - found at the tips of the arms; the arms are called the Fab region. If one relies entirely on binding, one can have problems with cross reactivity, the precise nature of a CDR can be determined by a hybrid "immune capture"/digestion/mass spec approach.
Antibodies come in two flavors, neutralizing and binding - binding can represent a signaling tool - and there is considerable evidence that other factors are involved in protection or recovery from Covid, notably T-Cells. As it sounds, "neutralizing antibodies" prevent viral infection, preventing the viral particle from entering a cell; T-cells destroy the viral particles completely.
Nevertheless, the biomarker discussed in the news item focuses on neutralizing antibodies.
The news item and the motivating paper are probably open sourced, but a few excerpts first from the news item:
The study is the best attempt yet to define features of the immune response that can act as a proxy for protection against COVID-19, known as a ‘correlate of protection’, says Daniel Altmann, an immunologist at Imperial College London. “Finding the correlate of protection has really been a holy grail for this disease, as for others. It’s surprisingly hard to do.”
If researchers have a well-defined correlate of protection, they can predict from early trial data how effective a vaccine will be, says James Triccas, a medical microbiologist at the University of Sydney in Australia and a co-author of the study. This “alleviates the need to do larger, more expensive and time-consuming phase III trials”.
Triccas and his colleagues examined neutralizing-antibody data from trials of seven widely used vaccines. The team found a strong link between participants’ antibody levels recorded in early-stage trials and vaccine-efficacy results from late-stage trials. The researchers estimate that a vaccine has an efficacy of 50% even if it induces antibody levels 80% lower than those found, on average, in a person who has recovered from COVID-19.
Vaccines that generated the strongest neutralizing-antibody responses, such as the mRNA-based vaccines made by Moderna and Pfizer–BioNTech, were the most protective. Vaccines that induced a weaker response, which included the Oxford–AstraZeneca jab, provided lower levels of protection.
The researchers predict that because antibody levels wane over time, booster shots might be needed in about a year, but protection against severe disease could last many years even without them.
The findings help to explain why, despite studies showing that some variants of the SARS-CoV-2 coronavirus reduce the ability of neutralizing antibodies to block infection, most people who have been vaccinated, even with just one dose, don’t fare too badly if infected with those variants, says Altmann...
Excerpts and a few graphics suggesting when the need for booster shots will be required, from the referenced paper:
A critical challenge at present is to identify the immune correlate(s) of protection from SARS-CoV-2 infection and thereby predict how changes in immunity will be reflected in clinical outcomes. A defined correlate of protection will permit both confidence in opening up economies and facilitate rapid improvements in vaccines and immunotherapies. In influenza infection, for example, a hemagglutination inhibition (HAI) titer of 1:40 is thought to provide 50% protection from influenza infection7 (although estimates range from 1:17 to 1:110, refs. 8,9). This level was established over many years using data from a standardized HAI assay10 applied to serological samples from human challenge and cohort studies. This assay is used to predict vaccine efficacy and to assist in the annual reformulation of seasonal influenza vaccines. At present, however, there are few standardized assays for assessing SARS-CoV-2 immunity, little data comparing immune levels in susceptible versus resistant individuals, and no human challenge model11.
The data currently available for SARS-CoV-2 infection include immunogenicity data from phase 1 and 2 studies of vaccines, and data on protection from preliminary reports from phase 3 studies and from seropositive convalescent individuals (Supplementary Tables 1 and 2). Although antiviral T and B cell memory certainly contribute some degree of protection, strong evidence of a protective role for neutralizing serum antibodies exists. For example, passive transfer of neutralizing antibodies can prevent severe SARS-CoV-2 infection in multiple animal models,12,13 and Regeneron has recently reported similar data in humans14...
Since different antibody assays were utilized in different clinical trials for different vaccines, the authors developed a method of normalizing them.
They found that neutralizing antibody levels correlated well with protection from active symptomatic infection or reinfection.
Some figures from the text:
Fig. 1: Understanding the relationship between neutralization and protection.
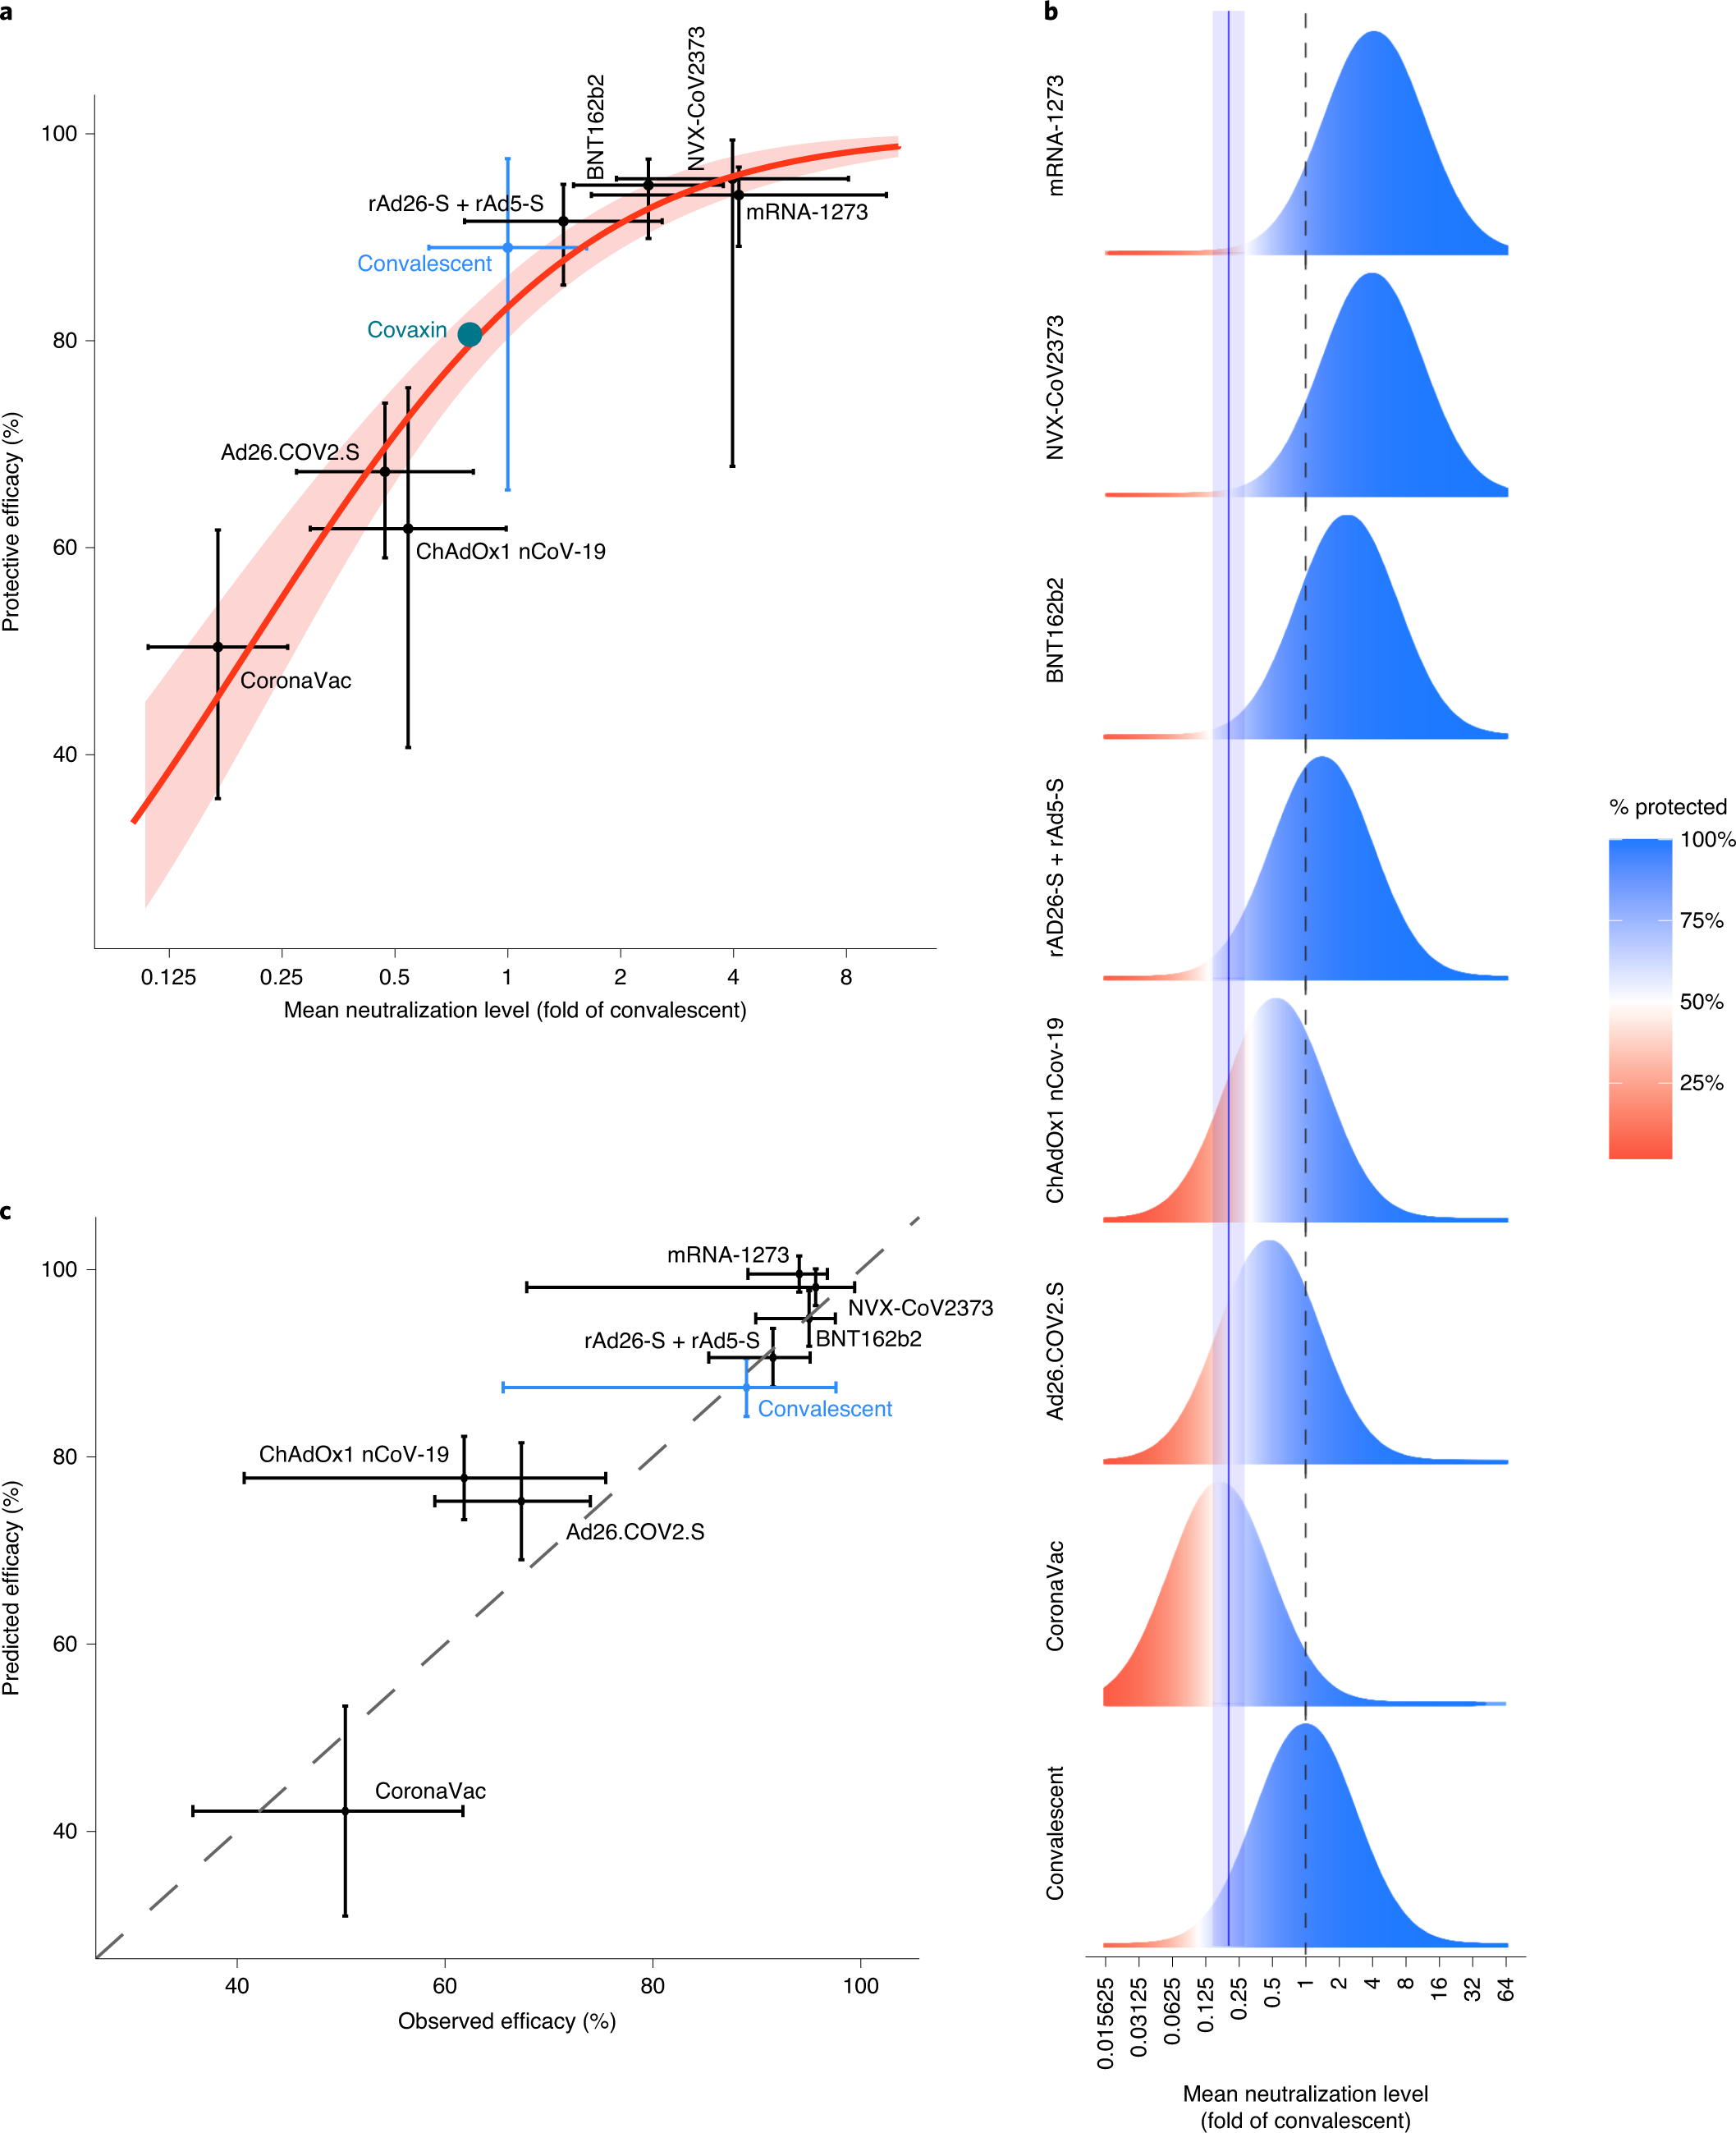
The caption:
Fig. 2: The effects of waning neutralization titer on protection.
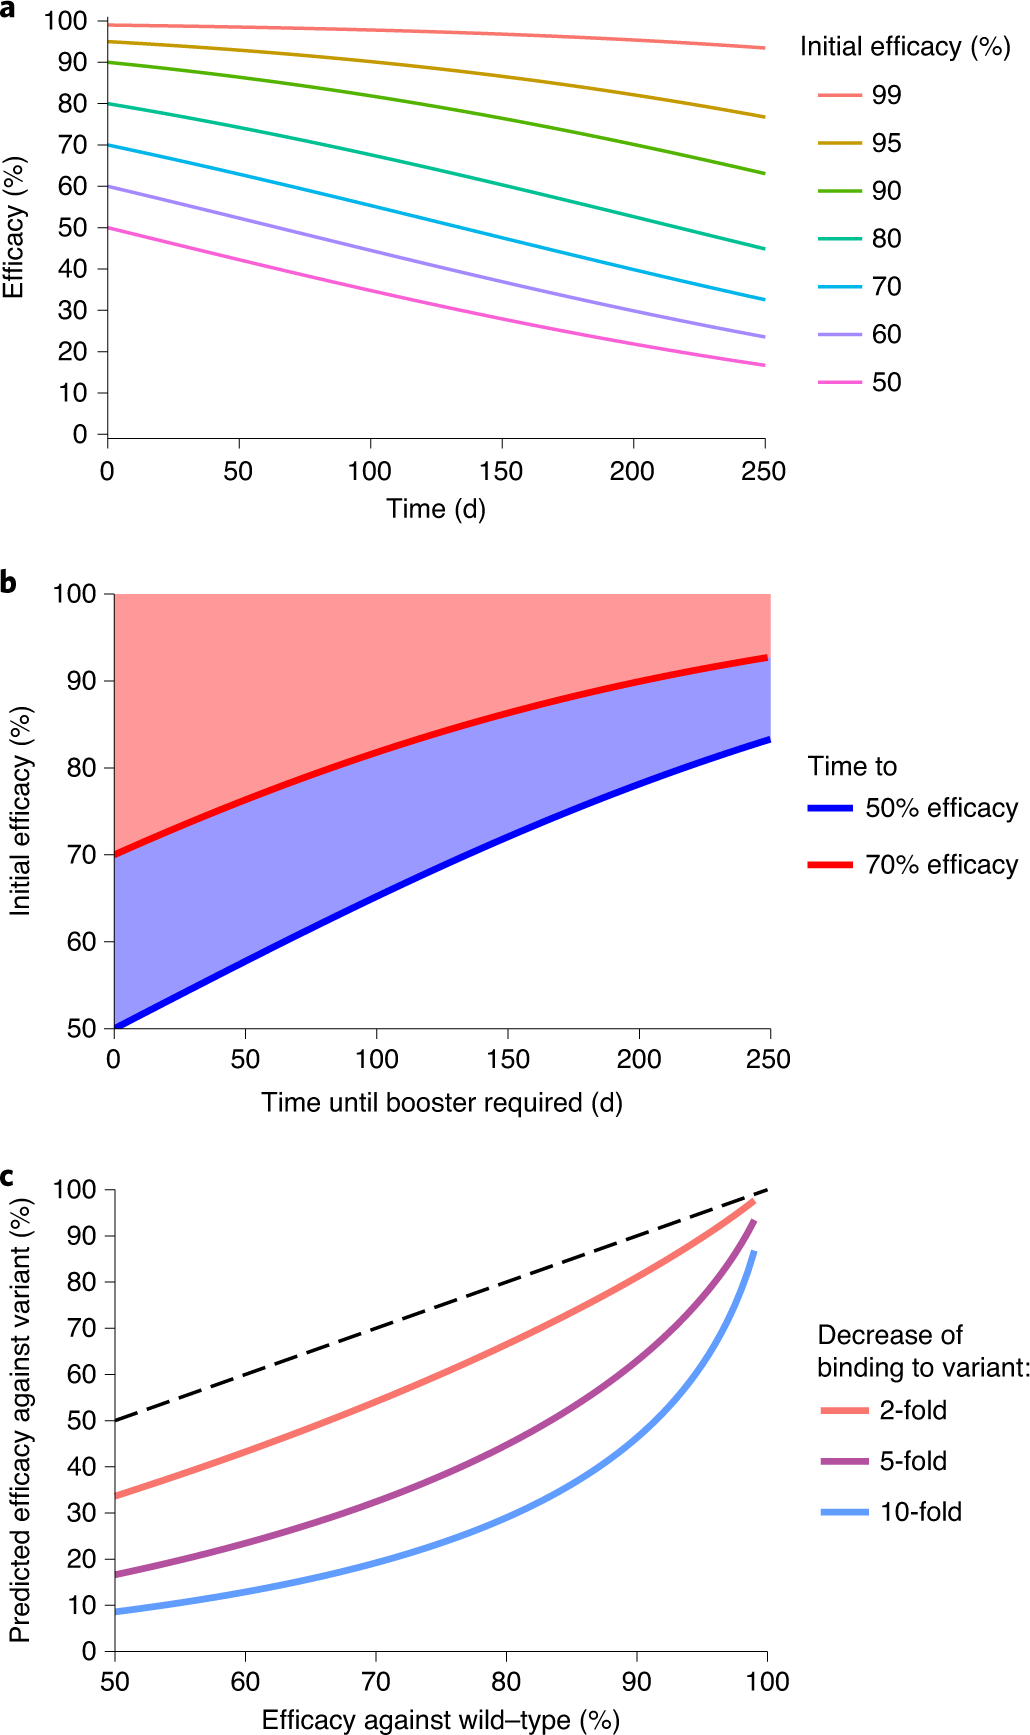
The caption:
Fig. 3: Protection from severe infection.
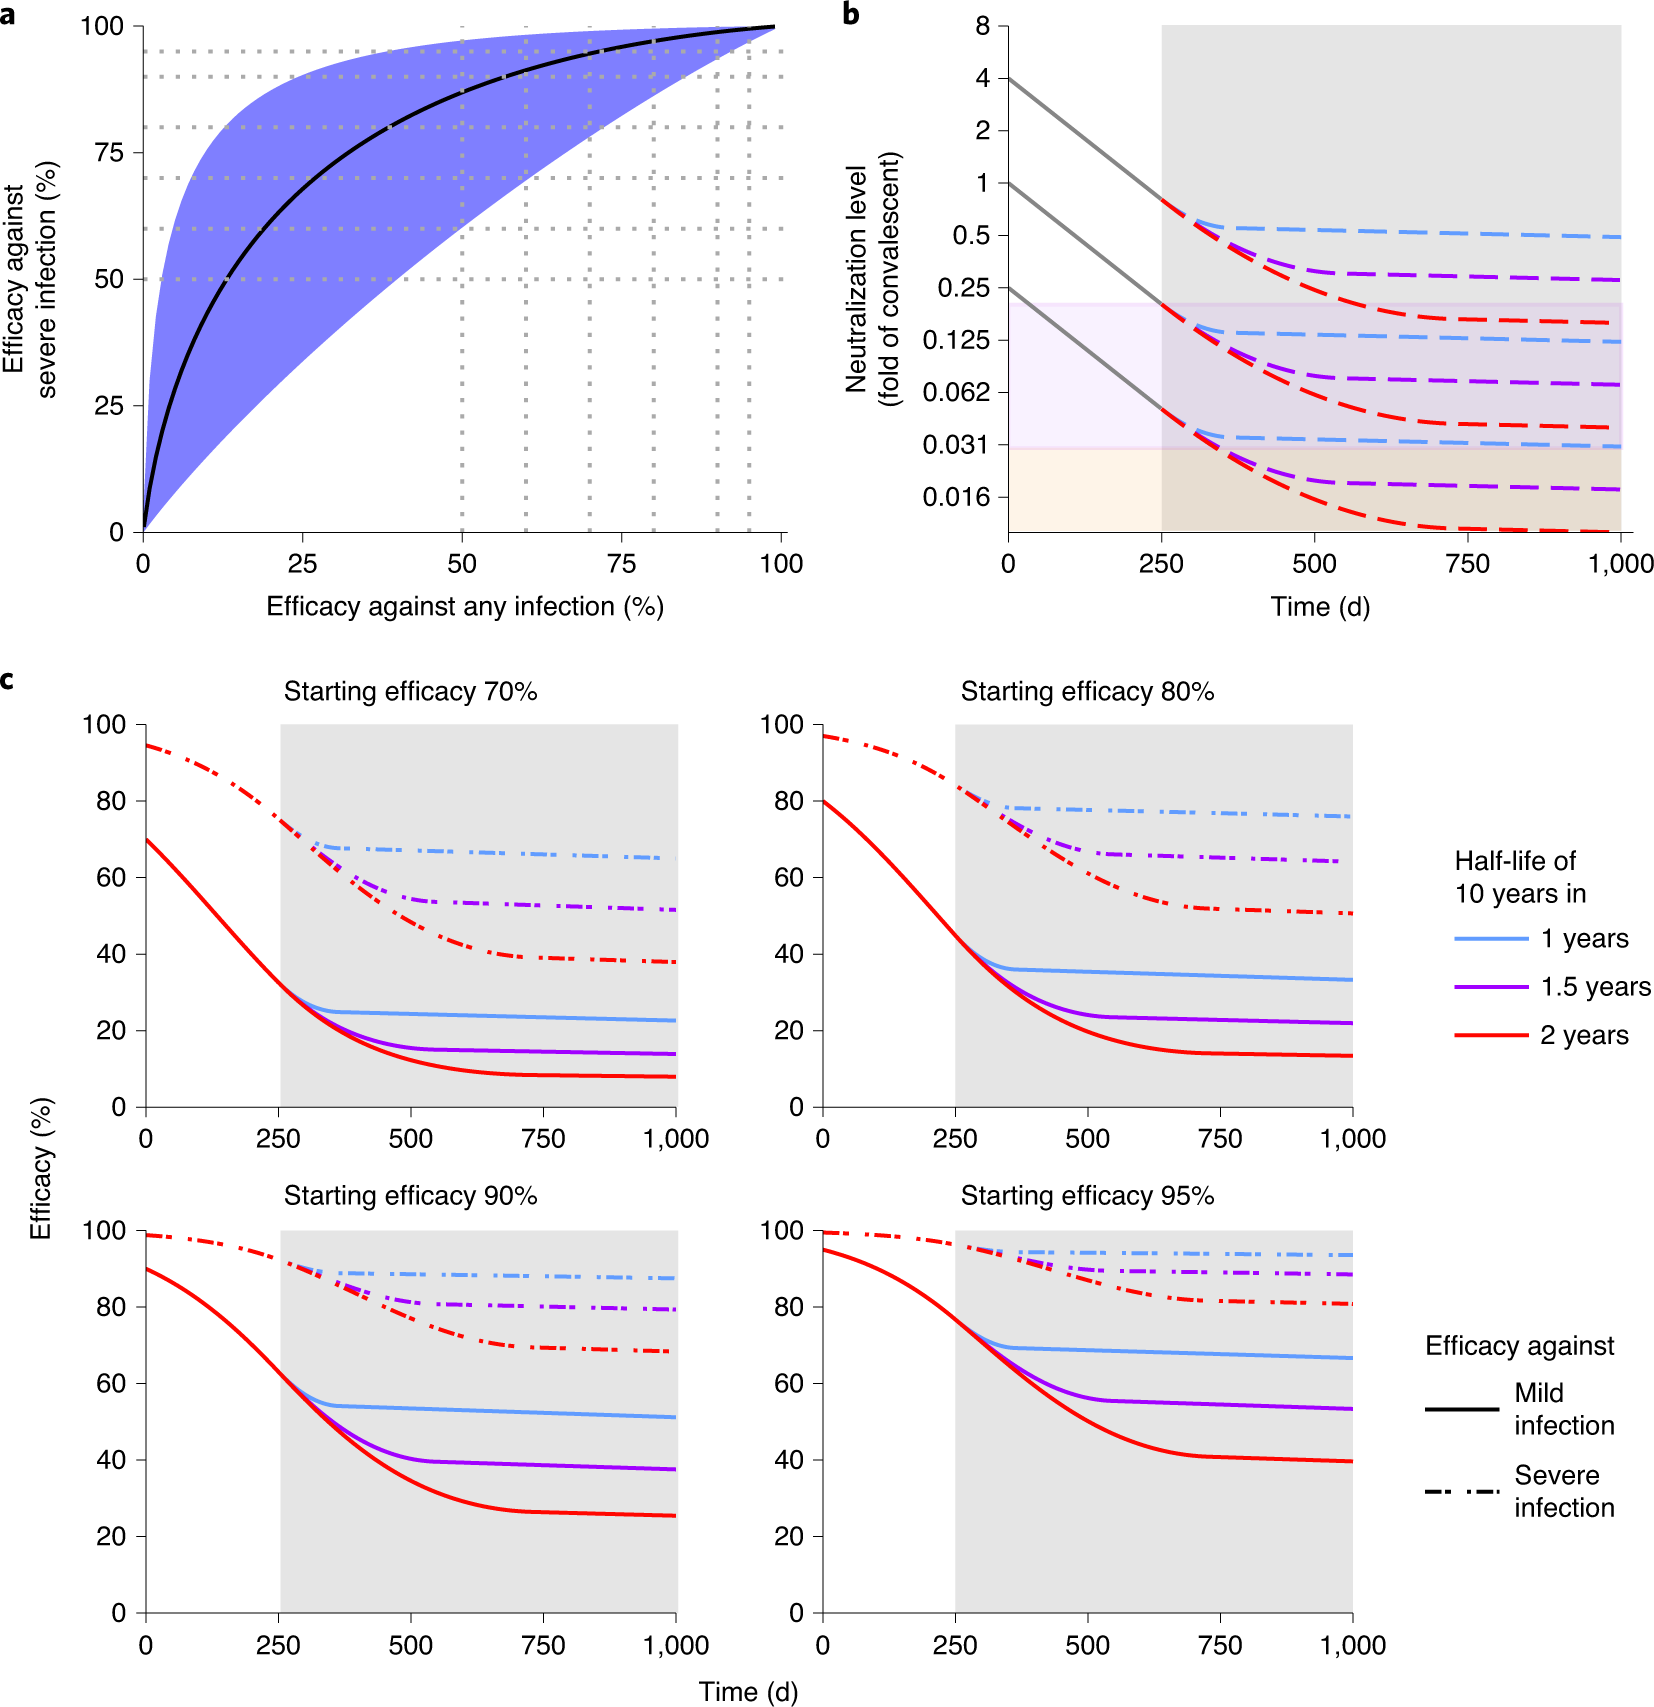
The caption:
Some additional commentary by the authors:
The scientific community deserves a pat on the back for the speed and efficiency with which they have addressed this crisis in record time, despite the rising power of ignorance, indifference, mysticism, and the wide dissemination of outright lies.
Have a safe and happy weekend.
IEA Prediction on Coal Growth as Compared to the Growth of All Renewables Combined.
Here, on the political left, we have bet the future of the planet on so called "renewable energy," to address the on going collapse of the planetary atmosphere: Nevertheless for the week beginning April 25, 2021, the average concentration of the dangerous fossil fuel waste in the planetary atmosphere, measured at the Mauna Loa observatory was 420.01 ppm, just 7 years and 11 months after it hit 400 ppm for the first time. (Week beginning 5/26/2013, 400.03 ppm, 9 years and one month after first hitting 380 ppm, 4/4/2004, 380.2).
That increase of 40 ppm took place in a little less time than I've been writing at DU. For the whole time I've been here, I've been hearing, albeit with increasing disbelief, how wonderful so called "renewable energy" is, how it's replacing nuclear energy and how we don't "need" nuclear energy. Lately there's been some after the fact lip service to how the so called "renewable energy" industry is driving the coal industry out of business.
Every year for the last 15 years or so, I've been able to download the World Energy Outlook put out each year by the International Energy Agency (IEA).
Covid has restricted some of my literature access, in particular the 2020 World Energy Outlook full report.
Nevertheless, the IEA has teasers on their websites, littered with misleading and somewhat dishonest "percent talk." If you buy access to the full report, you can find units of energy however - the unfortunate unit MTOE (million tons oil equivalent) that can nevertheless be converted to the SI unit, Exajoule (EJ).
Here's the teaser page: Global Energy Review: Key Findings.
For all those folks who keep saying "Coal is Dead" and claiming that somehow the solar and wind industry has killed it, I quote:
The bold, which to me says all I need to know about fantasy and reality, was added by me.
The primary energy production of wind and solar energy combined has never matched the primary energy production of nuclear energy, albeit obscured by the lie that a solar farm which has a theoretical peak capacity of 1 GW but might reach that power output for a few seconds on a sunny summer solstice day is the equivalent of a nuclear plant with a peak capacity of 1 GW that operates continuously at or near that power level for years at a time, without shutting down.
Constrained by fear, ignorance, selective attention, and raw stupidity, the nuclear industry has never, not once, produced as much energy as the coal industry, although for the first time, the nuclear industry has grown beyond 30 EJ per year.
After half a century of wild cheering for it, and the expenditures of trillion dollar quantities of money on it, the solar industry produces 2 EJ per year.
World energy demand as of 2019 was about 603 EJ, dominated by dangerous oil, then dangerous coal, and then dangerous natural gas, followed by the combustion of biomass. The waste from these fuels, which nobody knows how to address, kills in the form of air pollution, about 7 million people per year. It is also driving climate change, with extreme weather adding to the death toll.
Don't worry be happy.
Go join Bill McKibben's 350.org, where you can hear about losing, oh, 70 ppm in some magic "renewable energy" future. He's been prattling on year after year after year, but hasn't learned to say the word "nuclear" lest he offend one of his bourgeois contributors.
History will not forgive us; nor should it.
Have a nice weekend.
Greenhouse Gas and Health Benefits of Electric Vehicles on a Heavily Nuclearized Grid.
The paper I'll discuss in this post is this one: Health and Climate Incentives for the Deployment of Cleaner On-Road Vehicle Technologies (Laura Minet, An Wang, and Marianne Hatzopoulou Environmental Science & Technology 2021 55 (10), 6602-6612)
Many people question how I can simultaneously be an opponent of the electric car fantasy while also being an advocate of nuclear energy. This is because most people - and many nuclear energy advocates do engage in the greenwashing of electric cars - think of nuclear energy primarily as a tool for generating electricity. A conservative is, of course, a person who believes that everything should remain as it is and has been and that nothing should be tried for the first time, and thus the belief that electricity is the only possible product of nuclear energy is a conservative idea, and thus, as the world environment rapidly deteriorates at an accelerating pace, this belief is a dangerous idea.
I insist that electric cars are not sustainable for the same reason that so called "renewable energy" is not sustainable, specifically because of the high mineral mass requirement. (The IEA recently published several reports on this issue, which is slowly leaching into a conscious reality for anyone who is paying attention, albeit this with the understanding that lying to oneself is much easier than paying attention, and thus paying attention is not widely practiced.)
Nevertheless I found the paper cited at the outset to be quite interesting, not because I approve of electric cars, but because it emphasizes the reason that, despite all the attention paid to Chernobyl and Fukushima by the easily misled, nuclear energy, overall, saves lives; to wit: By the prevention of air pollution.
An electric car running in a area powered by dangerous fossil fuels - I discussed a paper in this same journal on the subject of electric vehicles in China (where there are 100 million such vehicles, albeit mostly scooters) - is merely a device for generating more pollution while wasting energy.
This study however discusses the Toronto, Canada area. Before excerpting anything connected with other aspects of the paper, before even excerpting the paper's introduction, let me excerpt this text about the generation of electricity on the grid serving Toronto as of 2016.
Only 9% of the grid depends on dangerous fossil fuels, and that is probably connected with backup of the largely useless and environmentally unacceptable wind industry. (I'm not particularly fond of hydroelectricity either; I'm a free river kind of guy.)
An "EV" is of course, an electric car, a "BEB" is a "battery electric bus."
The graphic at the outset the paper, which is available merely by clicking on the link above, which will give the abstract lays it out in terms of lives saved from air pollution, which now is killing about 7 million people per year while people carry on about Fukushima.
Here it is:

The nuclear infrastructure in Canada is almost entirely CANDU reactors, heavy water reactors, designed to run on unenriched uranium, albeit at low burn-ups. The burn-ups of CANDUs could, in theory, be extremely high, were they fueled on a ternary mixture of plutonium, depleted (or natural) uranium and thorium, or by uranium recovered from so called "nuclear waste" and thorium, and other approaches, mostly being explored in India, which also relies on heavy water reactors for clean nuclear energy.
Although a CANDU is basically a device only useful for generating electricity, I am still very fond of this reactor type and I wish we had a lot of them in the US, but we don't. They can in theory run for a very long time on the uranium component of so called "nuclear waste" in a cycle known as the "DUPIC" cycle, with the added benefit of producing significant neptunium for anti-proliferation purposes.
Anyway.
From the introductory text of the paper:
Light- and heavy-duty vehicles and transit buses constitute the majority of the on-road vehicle fleet in Canada.(8) Different approaches can be adopted to tackle their impacts on population exposure and health. Traffic management strategies (TMSs), such as congestion pricing, low emission zones, truck/bus lanes, or transit improvement, can be implemented. However, the use of TMS for improving ambient air quality is not always efficient because they can be counterbalanced by indirect effects (e.g., increased traffic volumes induced by congestion mitigation strategies and traffic diversion to different areas as a result of tolling and restrictions).(9) Therefore, such initiatives should be complemented by tackling the emissions at the source through a replacement of the existing fleet by lower-emitting vehicles. For private passenger vehicles (i.e., cars and SUVs owned by private households) and transit buses, vehicle electrification is often seen as an opportunity to decrease GHG emissions, and since electric vehicles (EVs) and battery electric buses (BEBs) do not generate exhaust emissions, electrification has also been promoted to reduce traffic-related air pollution, especially in regions with relatively clean electricity production.(10?13) For commercial vehicles (i.e., light-duty and heavy-duty), Pan et al.(14) highlighted that eliminating high-emitting trucks would bring substantial improvements in population exposure and health.
There are only few studies comparing the co-benefits of GHG mitigation strategies targeting all three fleets of vehicles. In India, Dhar and Shukla(15) quantified the changes of air pollutant emissions resulting from different policies involving sustainable technologies, fuels, and logistics for private cars, transit buses, and commercial vehicles. However, they did not quantify the implications on air quality, population exposure, and health. In the U.K., Smith et al.(16) analyzed the co-benefits and conflicts associated with measures aiming for a reduction of the carbon budget of the country, but the strategies incorporated in the scenario studied were broad and encompassed measures that went beyond improvements of vehicle fleets.
In this study, we applied an integrated framework combining a traffic assignment model with an air quality model to evaluate the health implications of a series of transportation scenarios designed by a panel of sustainable transportation experts in the context of the Greater Toronto and Hamilton Area (GTHA), the largest metropolitan area of Canada...
The methods utilized by the authors:
The scenarios:
...Scenario 1 (S1—100% EV) assumes an electrification of the private passenger vehicle fleet;
Scenario 2 (S2—100% BEB) assumes an electrification of the transit bus fleet;
Scenario 3 (S3—cleaner trucks) assumes that trucks older than 8 years have recently been renewed. The rationale behind this choice is that most scrappage programs are for vehicles of that age; few target trucks, but those for private passenger vehicles implemented in Europe are usually applicable for vehicles older than 8–10.(20,21)...
Some graphics describing their findings:

The caption:

The caption:

The caption:

The caption:
Discussing the lives saved (or in this case potentially saved) by nuclear energy is not as sexy as getting a wedgie in one's underwear worrying about critical zones in the wreckage of the Chernobyl reactor, but if we were serious - and we're not, as we hit 420 ppm of CO2 in the planetary atmosphere this year while literally Quixotically genuflecting endlessly at wind turbines - it would matter that overall, nuclear energy saves lives.
In the conclusion the authors, in a clear burst of honesty reflecting the (huge) caveat write this:
To conclude, this analysis highlights the necessity to tackle the emissions from all categories of vehicles: private passenger vehicles because they are important sources of GHG emissions and responsible for substantial social costs related to air pollution exposure; commercial vehicles because they are responsible for more than half of the YLL and premature deaths attributed to traffic-related air pollution exposure in the GTHA; and transit buses because they are operating in densely populated areas and their emissions have therefore higher health impacts in proportion.
I have added the bold in the above excerpt.
I don't know if this will inspire anyone to light a candle in one of the many temples for worshipping Elon Musk. I have no use for the guy, but feel free to do so if so inspired by this interesting paper.
I hope you will have a pleasant and safe day tomorrow.
A little Godwin type history.
Hitler destroyed the Weimar democracy using means that we're legal under the Weimar constitution.
The White Supremacy Party, misidentified as the "Republican" Party, like the consumate racist preceeding them, are now engaged in a similar effort to destroy and overthrow the American democracy, the same way, legal obstructions and overt lies.
History will surely judge McConnell, Trump and Putin as they succeed in destroying country severely, but frankly, Hitler himself was unaffected by his historic reputation.
This is an old playback, and they're using it.
First nuclear detonation created 'impossible' quasicrystals
A news item from Nature, it's probably open sourced:
First nuclear detonation created ‘impossible’ quasicrystals
Their structures were once controversial. Now researchers have discovered quasicrystals in the aftermath of a 1945 bomb test.
Davide Castelvecchi, Nature News, May 17, 2021
Excerpts:
The previously unknown structure, made of iron, silicon, copper and calcium, probably formed from the fusion of vapourized desert sand and copper cables. Similar materials have been synthesized in the laboratory and identified in meteorites, but this one, described in Proceedings of the National Academy of Sciences on 17 May, is the first example of a quasicrystal with this combination of elements1.
Impossible symmetries
Quasicrystals contain building blocks of atoms that — unlike those in ordinary crystals — do not repeat in a regular, brickwork-like pattern. Whereas ordinary crystal structures look identical after being translated in certain directions, quasicrystals have symmetries that were once considered impossible: for example, some have pentagonal symmetry, and so look the same if rotated by one-fifth of a full twist.
Materials scientist Daniel Shechtman, now at the Technion Israel Institute of Technology in Haifa, first discovered such an impossible symmetry in a synthetic alloy in 1982. It had pentagonal symmetry when rotated in each of various possible directions, something that would occur if its building blocks were icosahedral — that is, had a regular shape with 20 faces. Many researchers initially questioned Shechtman’s findings, because it is mathematically impossible to fill space using only icosahedrons. Shechtman ultimately won the 2011 Nobel Prize in Chemistry for the discovery.
At around the same time, Paul Steinhardt, a theoretical physicist now at Princeton University in New Jersey, and his collaborators had begun to theorize the possible existence of non-repeating 3D structures. These had the same symmetry as an icosahedron, but were assembled from building blocks of several different types, which never repeated in the same pattern — thus explaining why the mathematics of symmetrical crystals had missed them...
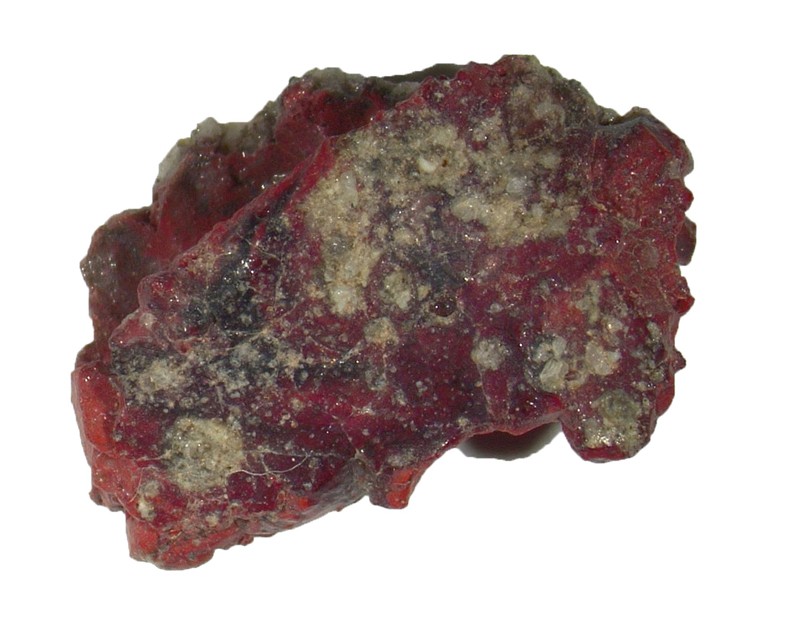
...‘Slicing and dicing’
In the aftermath of the Trinity test — the first ever detonation of a nuclear bomb, which took place on 16 July 1945 at New Mexico’s Alamogordo Bombing Range — researchers found a vast field of greenish glassy material that had formed from the liquefaction of desert sand. They dubbed this trinitite.
The plutonium bomb had been detonated on top of a 30-metre-high tower, which was laden with sensors and their cables. As a result, some of the trinitite that formed had reddish inclusions, says Steinhardt. “It was a fusion of natural material with copper from the transmission lines.” Quasicrystals often form from elements that would not normally combine, so Steinhardt and his colleagues thought samples of the red trinitite would be a good place to look for quasicrystals .
“Over the course of ten months, we were slicing and dicing, looking at all sorts of minerals,” Steinhardt says. “Finally, we found a tiny grain.” The quasicrystal has the same kind of icosahedral symmetry as the one in Shechtman’s original discovery.
Profile Information
Gender: MaleCurrent location: New Jersey
Member since: 2002
Number of posts: 33,563