NNadir
NNadir's JournalUnprotected African health workers die as rich countries buy up COVID-19 vaccines
This is a news item from Science: Unprotected African health workers die as rich countries buy up COVID-19 vaccines (Science, By Kai KupferschmidtFeb. 17, 2021 , 2:45 PM)
It should be open sourced.
Some excerpts:
On 6 January, gastroenterologist Leolin Katsidzira received a troubling message from his colleague James Gita Hakim, a heart specialist and noted HIV/AIDS researcher. Hakim, chair of the department of medicine at the University of Zimbabwe, had fallen sick and had tested positive for COVID-19. He was admitted to a hospital in Harare 10 days later and moved to an intensive care unit (ICU) after his condition deteriorated. He died on 26 January.
It is a crushing loss to Zimbabwean medicine, Katsidzira says. “Don’t forget: We have had a huge brain drain. So people like James are people who keep the system going,” he adds. Scientists around the world mourned Hakim as well. He was “a unique research leader, a brilliant clinical scientist and mentor, humble, welcoming and empowering,” wrote Melanie Abas, a collaborator at King’s College London.
But Hakim’s death also highlights a stark reality in the global response to the coronavirus pandemic. Countries in Europe, Asia, and the Americas have administered more than 175 million shots to protect people against COVID-19 since December 2020, with most countries giving priority to medical workers. But not a single country in sub-Saharan Africa has started immunizations—South Africa will be the first, this week—leaving health care workers dying in places where they are scarce to begin with...
...According to the World Health Organization (WHO), three-quarters of all vaccinations so far have happened in 10 countries that account for 60% of global gross domestic product; 130 countries have yet to administer a single dose. “I don’t know why there isn’t a massive clamor to do something about that,” says Gavin Yamey of Duke University’s Global Health Institute. “The world is on the brink of a catastrophic moral failure,” Tedros Adhanom Ghebreyesus, the Ethiopian-born director-general of WHO, said in January...
...Beyond the moral argument, there are sound economic and public health reasons to close the gap. Vaccinating those most at risk around the world would drive down hospitalizations and deaths everywhere sooner, allowing societies to reopen and economies to recover. It could also help reduce circulation of the virus globally, lowering the risk of new virus variants emerging...
If I were President Biden, I'd head to Texas as soon as it is safe to do so.
Personal Presidential attention is a key in disaster like this.
With his feet on the ground, he will raise the spirits of our suffering countrymen.
I'm not glorying in what's happening in Texas. Beto got 48%+ of the vote there.
That means that 48%+ of the people of Texas are good people not wallowing in racist libertarian secessionist horse shit.
Real people, very good people, are suffering. (One of them is my niece.)
I lived two weeks without power after Hurricane Sandy. There's nothing funny about it; nothing at all.
I hope President Biden will send aid to Texas. They need our aid and our sympathy.
The African American Woman Who Helped Design of the Moderna Vaccine Is Fighting Vaccine Hesitancy.
This a news item in Nature:
This COVID-vaccine designer is tackling vaccine hesitancy — in churches and on Twitter
Immunologist Kizzmekia Corbett helped to design the Moderna vaccine. Now she volunteers her time talking about vaccine science with people of colour.
It should be open sourced, but here are some excerpts:
Corbett is one of many Black scientists and doctors who are doing this outreach, often virtually, in their free time. Researchers say it’s necessary to make scientific knowledge accessible in public forums, to ease health disparities.
In the United States, COVID-19 has affected Black, Native American and Latino American people at higher rates than white people, for reasons rooted in racism and historical segregation. At the same time, people in these groups are more wary of COVID-19 vaccines. In a December survey by the US Centers for Disease Control and Prevention, 46% of Black adults said they probably would not get vaccinated against the coronavirus SARS-CoV-2, compared with 30% of white respondents...
...Before the COVID-19 outbreak, Corbett was part of a team at the NIH in Bethesda, Maryland, and elsewhere, that was designing vaccines for other coronaviruses in collaboration with Moderna. The scientists’ mRNA technology delivers a piece of genetic code to a person’s cells to create immune-stimulating virus proteins. When the outbreak began, the team mobilized to quickly identify the SARS-CoV-2 genetic sequence it would need to make a vaccine for COVID-19, which Moderna then produced...
...What was your role in designing a vaccine for SARS-CoV-2, and what was that like?
My contribution was helping to design the vaccine, leading the preclinical studies that informed the Phase I clinical trial and designing assays used for testing of clinical trial samples.
The quest in early January 2020 was to gear up. We started ordering all the things that we needed around animal experiments. We mapped out a plan. I started assigning roles to team members.
If you want to go fast in a pandemic, then messenger RNA (mRNA) is a shoo-in. It can be manufactured very quickly in very vast quantities, and it’s plug and play in that you can essentially just swap out the protein once you have the system down. We collaborated with Moderna so we could get the system down pat...
Dr. Corbett:

I got the Moderna vaccine this morning!
The arm is definitely sore, and I feel vaguely "funky," but so far, nothing worse than how I feel after a flu vaccine.
I'm really excited about the technology behind this vaccine, so this is something about which it is fun to think. Hell, I'm so happy I'll violate my grammatical rule that "A preposition is a part of speech one should never end a sentence with and say, "This is something fun to think about."
My 2nd dose is exactly 30 days away.
I got it at Princeton Penn Medicine Hospital (West Windor, NJ), where they had a very streamlined flow beginning with a short medical review. They scheduled the second dose during the 15 minute required recovery period. I was in and out in less than a half hour.
The staff was friendly, professional, & efficient. I have nothing but praise for the process.
It was a wonderful experience, and I feel great having made it to the first vaccine without contracting the disease.
I also found out this week that the hypochondria by which I was convincing myself that the symptoms I'm having were cancer apparently aren't cancer.
It doesn't get any better than this.
Finally, I have a Covid-19 vaccine appointment!!!
It's the Moderna baby, a very cool pharmaceutical design. I can't wait!
It's Saturday morning. I have to miss Science on Saturday's lecture which is about viral host shifting, but I'm kind of generally aware of the topic in any case.
I am an old fat guy in declining health, so this makes me quite happy, since I'm still very interested in living a bit longer. In terms of "bargaining" in confronting death, I'd love to live to give my son a hard time at his thesis defense for his Ph.D., and he's just started graduate school. (We'll see though, bargaining with death doesn't usually go very far.)
A wealth of discovery built on the Human Genome Project -- by the numbers:
The Human Genome Project was an understated initiative of the Clinton years, just as the space program was an initiative of the Kennedy/Johnson years.
"Big Science" changes the world, usually for the better.
From the Nature News sections, should be open sourced: A wealth of discovery built on the Human Genome Project — by the numbers. (Alexander J. Gates, Deisy Morselli Gysi, Manolis Kellis & Albert-László BarabásiNature 590, 212-215 (2021))
Some excerpts:
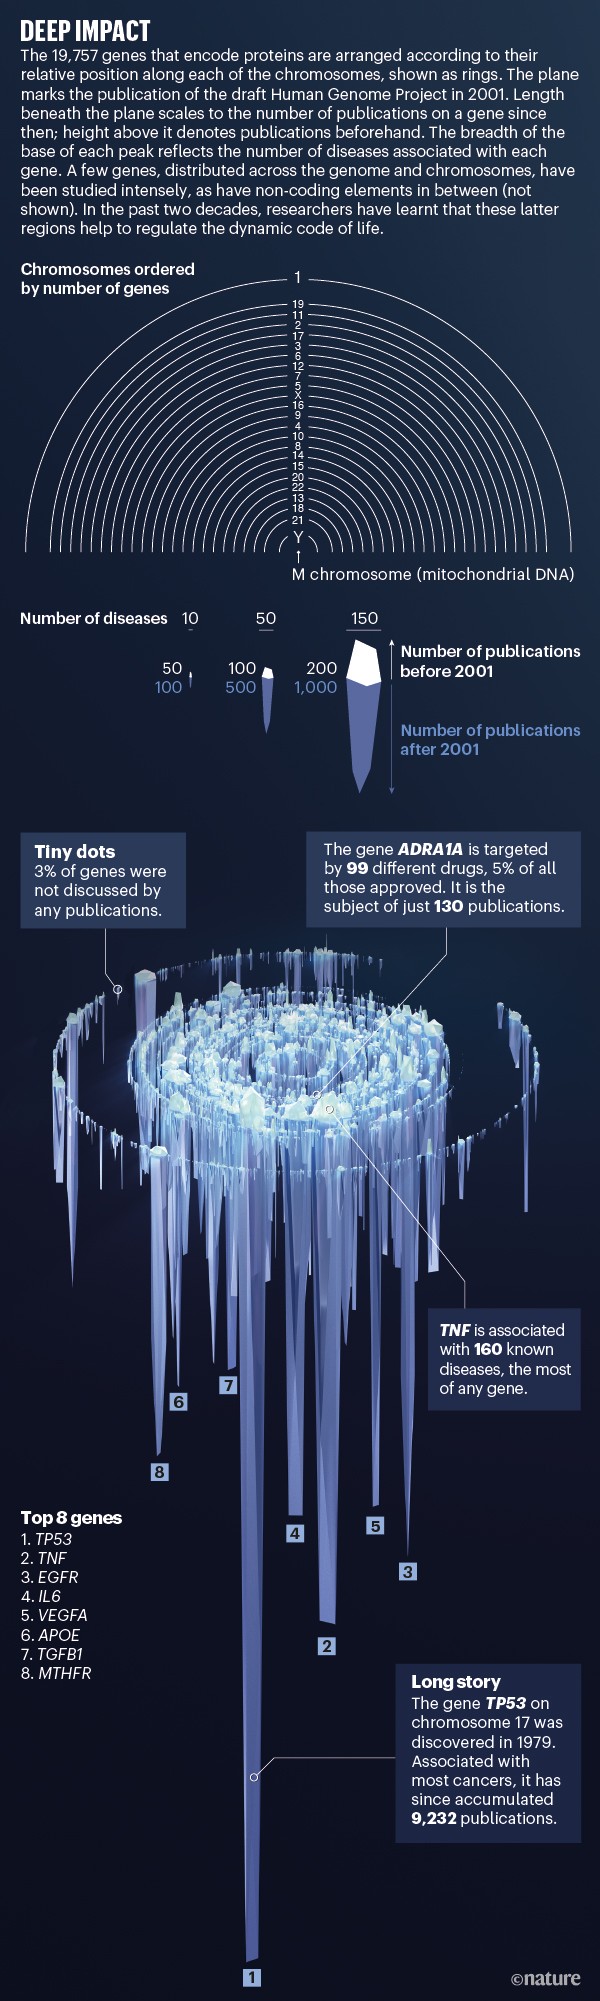
A new analysis traces the story of the draft genome’s impact on genomics since 2001, linking its effects on publications, drug approvals and understanding of disease.
The 20th anniversary of the publication of the first draft of the human genome1,2 offers an opportunity to track how the project has empowered research into the genetic roots of human disease, changed drug discovery and helped to revise the idea of the gene itself.
Here we distil these impacts and trends. We combined several data sets to quantify the different types of genetic element that have been discovered and that generated publications, and how the pattern of discovery and publishing has changed over the years. Our analysis linked together data including 38,546 RNA transcripts; around 1 million single nucleotide polymorphisms (SNPs); 1,660 human diseases with documented genetic roots; 7,712 approved and experimental pharmaceuticals; and 704,515 scientific publications between 1900 and 2017 (see Supplementary information; SI ).
The results highlight how the Human Genome Project (HGP), with its comprehensive list of protein-coding genes, spurred a new era of elucidating the function of the non-coding portion of the genome and paved the way for therapeutic developments. Crucially, the results track the emergence of a systems-level view of biology alongside the conventional single-gene perspective, as researchers mapped the interactions between cellular building blocks (see ‘No jump for big teams’)...
...These connections offer a snapshot of the evolution of the research landscape before and after the HGP. It shows an intense focus on a small number of ‘superstar’ protein-coding genes, potentially to the detriment of interesting work that could be done on others. There has been a pivot towards non-protein-coding sections of the genome, and to understanding interactions between genetic material and proteins. And drug discovery has been grounded in just a few protein targets.
Some of these trends are familiar to biologists, but to quantify and visualize them is to consider them anew...
...Superstar genes
The popular perception is that the HGP marked the start of the intensive search for protein-coding genes. In fact, the 2001 draft HGP paper signalled the end of a decades-long hunt1,2. Indeed, evidence for the first protein-coding gene emerged in 1902, with the discovery of the hormone secretin4 (SCT gene), 50 years before the structure of DNA was uncovered, and 75 years before genome sequencing became commonplace. Our analysis shows that, between the start of the HGP in 1990 and its completion in 2003 (after the draft was published in 2001), the number of discovered (or ‘annotated’) human genes grew drastically...
A graphic from the article:
...Drug discovery
Before about the 1980s, drugs were found largely by serendipity. Their molecular and protein targets were usually unknown. Until 2001, the probability of knowing all of a drug’s protein targets was less than 50% in any given year. The HGP changed this. Now, the targets are known for almost all drugs licensed in the United States each year (see ‘Twenty years of junk, stars and drugs: Drug targets’)...
This is evidence on how big science, funded by big Government, brings big results with big benefits to humanity.
Glacial episodes of a freshwater Arctic Ocean covered by a thick ice shelf
The article I'll discuss in this brief post is this one: Geibert, W., Matthiessen, J., Stimac, I. et al. Glacial episodes of a freshwater Arctic Ocean covered by a thick ice shelf. Nature 590, 97–102 (2021).
The ocean contains about 4.5 billion tons of uranium, chiefly in the +6 oxidation state as the UO2 2+ ion, cycled through it in a continuous process resulting from tectonic and volcanic activity, and precipitation. (The solubility of uranium in seawater is driven by oxygen in the planetary atmosphere; in general the oxy cations of the pre-curium actinides are far more soluble than the reduced forms.) The fact that the geochemical uranium cycle saturates the ocean with respect to uranium is the reason why uranium resources are inexhaustible at a high enough price.
Thorium, which is sometime represented as being more available than uranium - which it is, but only in terrestrial ores - is far less soluble in seawater, which is why it is not inexhaustible as a fuel and uranium is.
The uranium 238 decay series features two thorium isotopes, Thorium-234, which has a half-life of 24.1 days, and Thorium-230, which has a half-life of around 75,400 years. Because of the differential solubility of the two elements, the ocean is often in disequilibrium with its decay series; the uranium remains in the seawater, while the thorium precipitates and is incorporated in mud in the sea floor.
Waters deprived of access to salts are of course, fresh water. The authors of the paper cited exploited the absence of thorium-230, implying a lack of access to salt water having uranium in it, to show that the artic ocean may have been a fresh water body at one point in its history.
From the article's introduction:
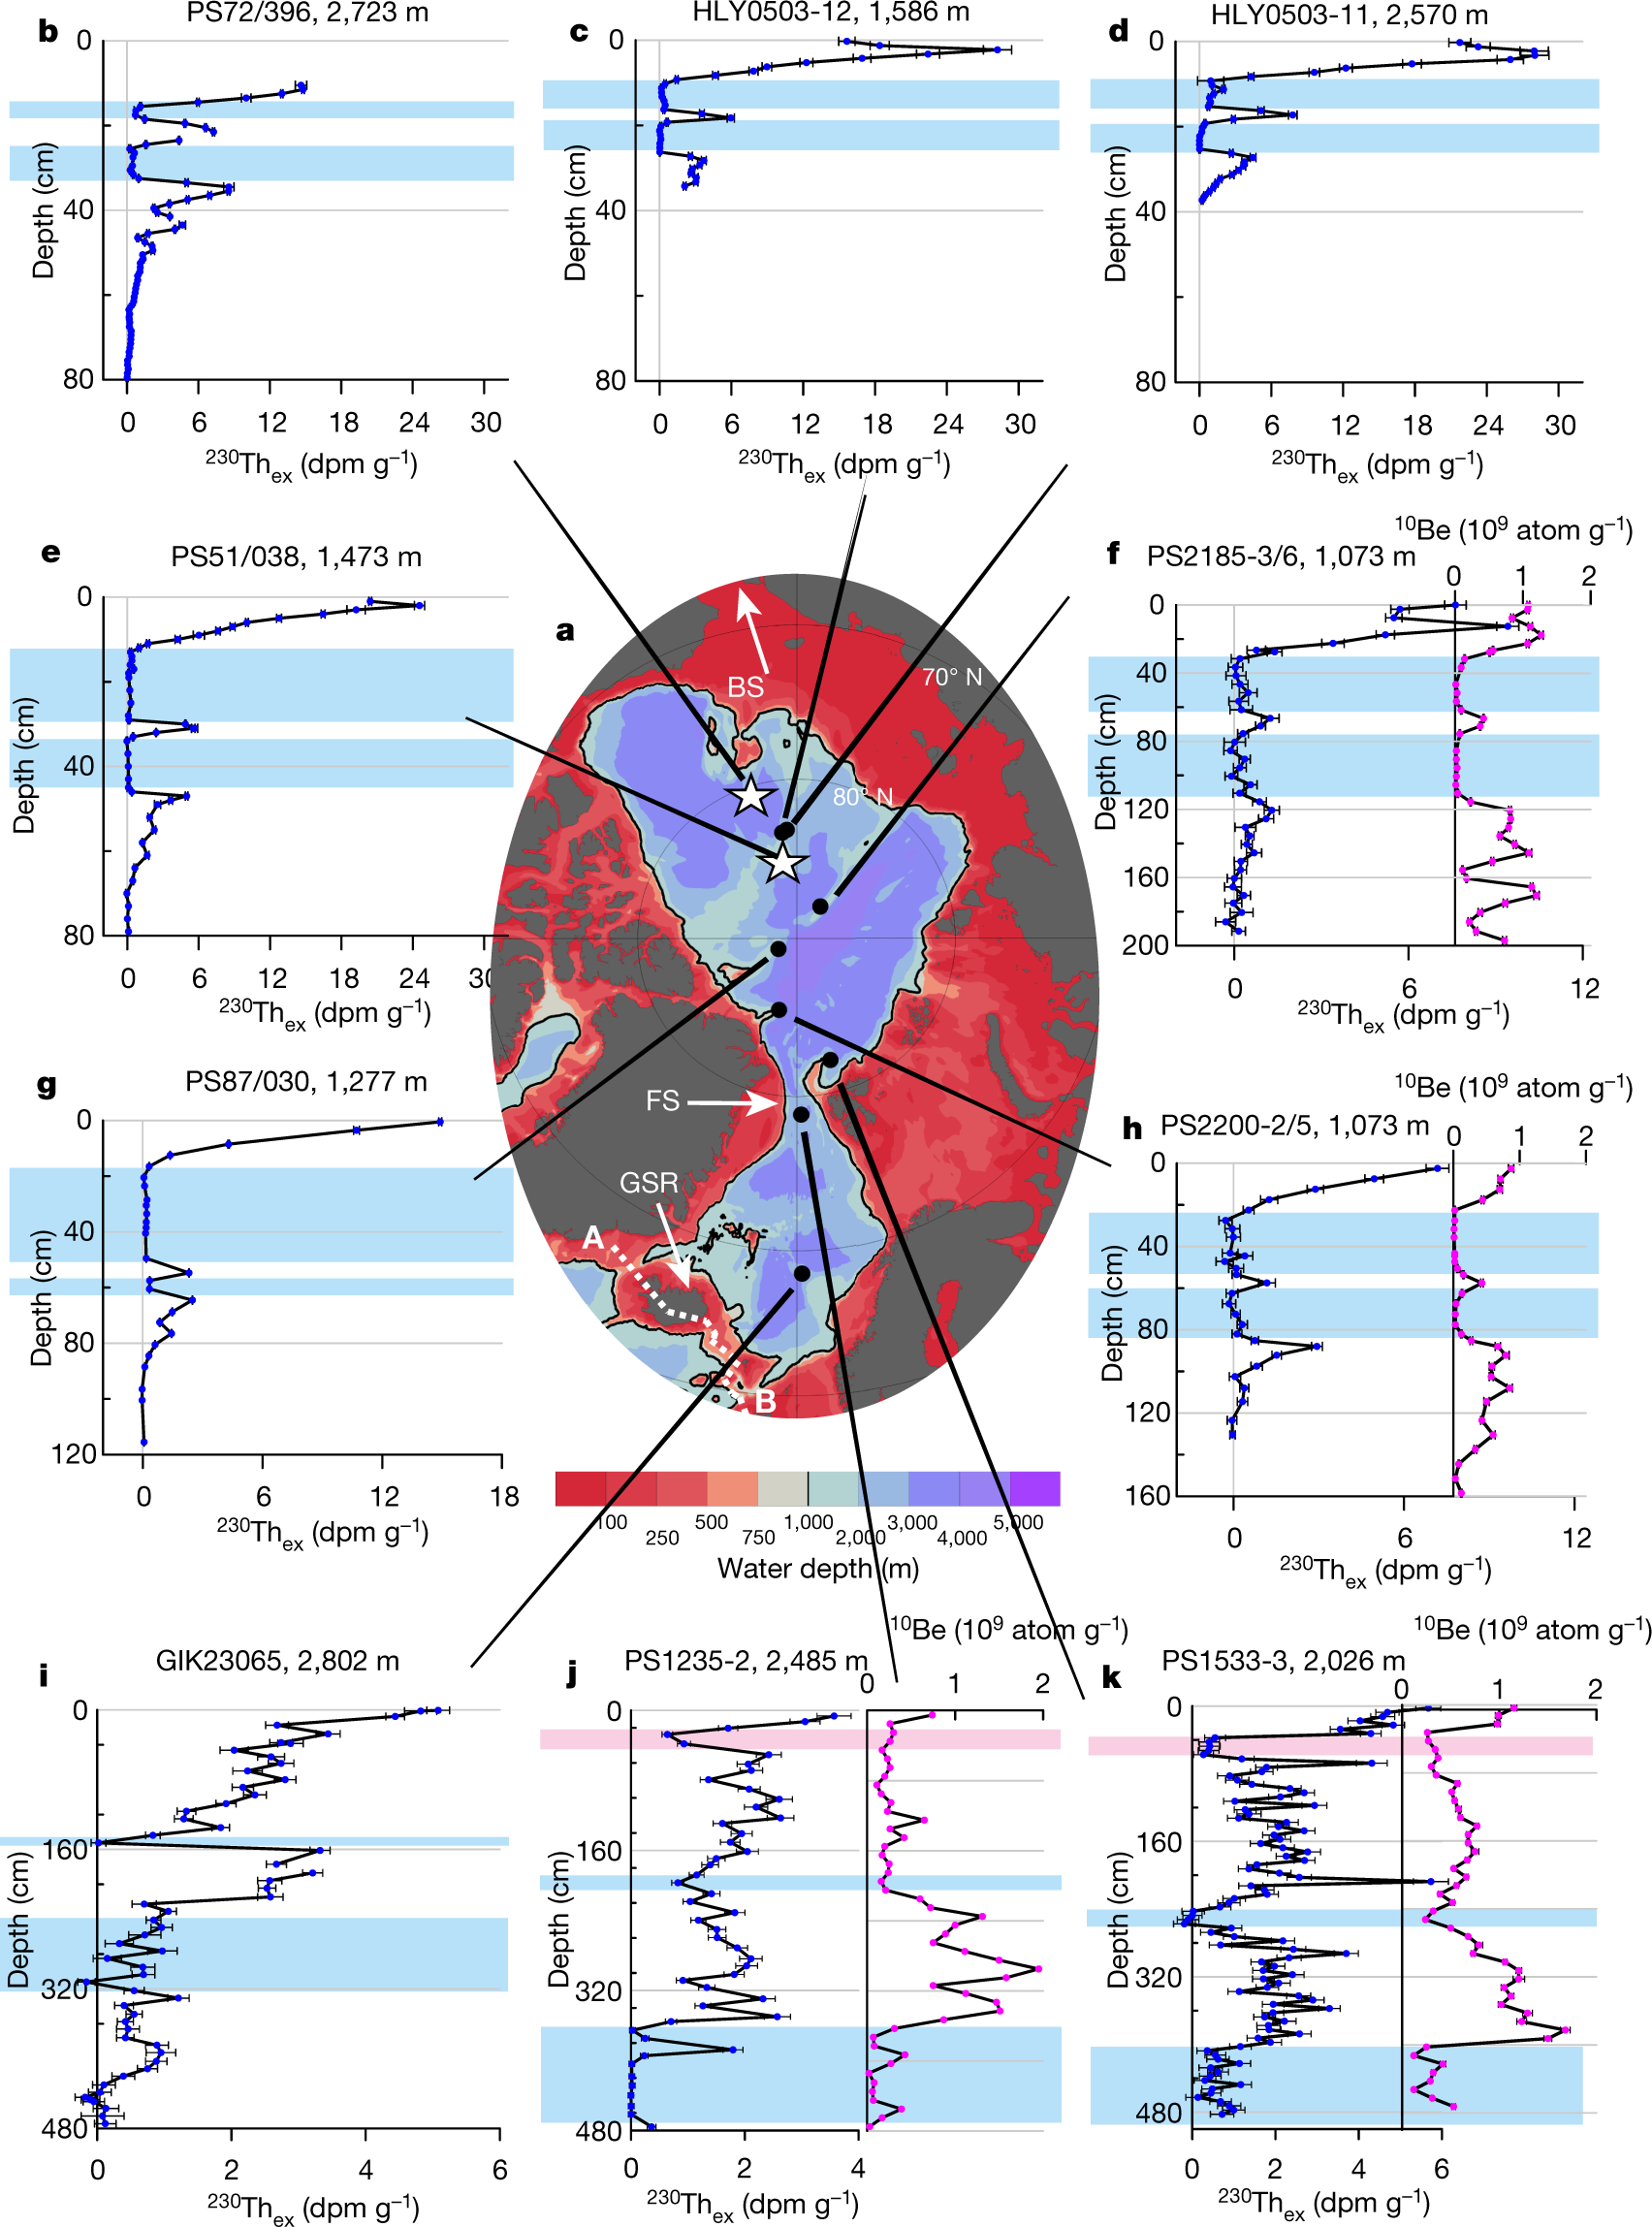
Once produced by decay, 230Th is known to be highly particle reactive and removed to the sea floor close to its site of production within years to decades15, even in very low-particle-flux environments, such as the Pacific Gyres16. One should therefore expect that a substantial amount of meteoric ice with a salinity of virtually zero would be seen as a reduction in the amount of deposited excess 230Th (230Thex). This reduction must be proportional to the amount of displaced seawater. A 1,000-m-thick ice shelf over a seafloor of 2,000-m depth would reduce the available 230Thex sediment inventory by half. If the water underlying the ice shelf had a reduced salinity as well, this would further reduce the 230Thex inventory correspondingly. For a water column consisting of only meteoric ice and freshwater, no 230Thex should be present.
Here we test this hypothesis on a set of sediment cores from the Arctic Ocean that cover the recent glacials; how many glacials exactly is a matter of ongoing debate17,18,19,20,21. We contribute two new high-resolution records of 230Th, together with uranium isotopes and elemental composition, and compare them to other 230Thex records to test our hypothesis and map the spatial and temporal extent of a shelf ice with underlying freshwater in the Arctic Ocean.
Figure 1 reveals two intervals with low or absent 230Thex observed across the entire Arctic and into the Norwegian and Greenland seas (hereafter, assumed to represent the Nordic seas). These minima occur in olive-grey to greyish sand-rich siliciclastic sediments that are virtually barren of autochthonous calcareous microfossils. They are mainly characterized by increased terrigenous coarse fraction, reduced bioturbation, and some laminations (see Methods for more details on lithology).
Fig. 1: A selection of 230Thex and 10Be records from the Arctic Ocean and the Nordic seas.
The caption:
The authors rule out several potential explanations for this phenomenon and conclude that because of ice dams, for periods in geological history, the arctic ocean was actually a fresh water lake.
The authors conclude by noting that this finding may have bearing on other studies of arctic geohistory and call for further research:
Interesting, I think.
Tracking QAnon: how Trump turned conspiracy-theory research upside down
This is an item from the news section of the scientific journal Nature: Tracking QAnon: how Trump turned conspiracy-theory research upside down
By Jeff Tollefson. (Nature 590, 192-193 (2021))
I believe it's open sourced, but a few excerpts anyway:
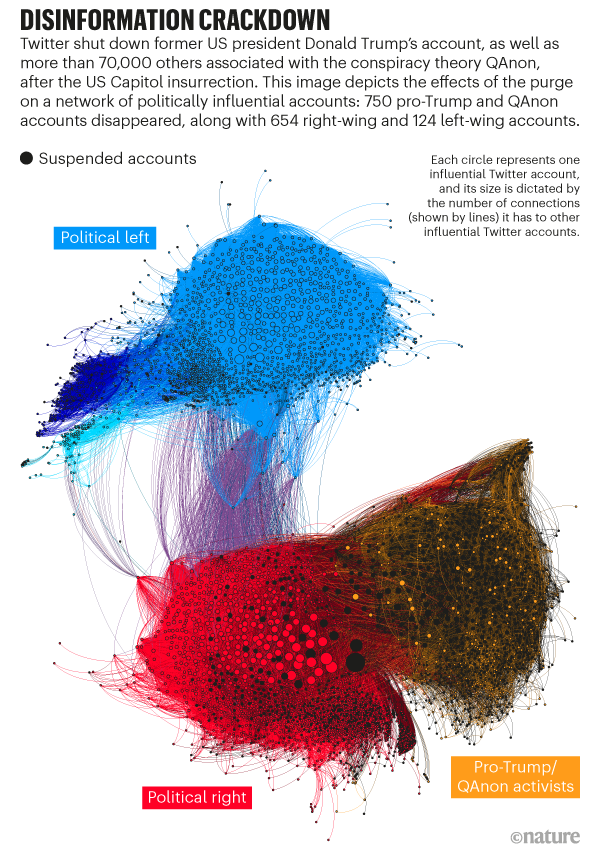
By taking fringe ideas mainstream, the former US president taught new and dangerous lessons about manipulating social and mass media.
For people around the world, the now-iconic images of a man in a horned headdress roaming the US Capitol during the 6 January insurrection came as a shock. For Kate Starbird, the images were frighteningly familiar. ‘QAnon Shaman’ — the online persona of Jacob Anthony Chansley, or Jake Angeli — is a known superspreader of conspiracy theories that her research group has been monitoring for years.
The storming of the Capitol was “this physical manifestation of all of these digital characters we’ve been studying”, says Starbird, a social scientist at the University of Washington in Seattle, who investigates the spread of disinformation on social media. “To see all of that come alive in real time was horrifying, but not surprising.”
The epic battle against coronavirus misinformation and conspiracy theories
Starbird is among a cadre of researchers in the United States and abroad who study the way disinformation and conspiracy theories take root and spread through social and mass media. As US president and a prolific tweeter, Republican Donald Trump turned their research upside down when he helped to push typically fringe theories into the mainstream — most recently by downplaying the coronavirus pandemic and promoting the unfounded claim that the US presidential election had been stolen from him.
With Trump out of office, this group of researchers is now working to make sense of the deluge of data that they’ve collected from platforms such as Twitter and Facebook. It’s been a lesson in modern populism: a world leader amplified once-obscure conspiracy theories, with each tweet and retweet strengthening the ideas and emboldening their supporters. Now, researchers are retooling to understand — and prepare for — what comes next...
...One debate in the conspiracy-theory research community is whether Trump has pushed more people into QAnon, or whether he just emboldened those who already believed. Polling suggests that QAnon adherents remain a small, if increasingly vocal, minority, says Joseph Uscinski, a political scientist at the University of Miami in Florida who has been tracking public support for several years...
...QAnon has clearly gained ground under Trump in recent years, says Joan Donovan, a disinformation researcher at Harvard University in Cambridge, Massachusetts. The activity that she and her team monitor online, as well as the real-world protests and political rallies taking place, add up to “a growing interest in or dedication to these ideas”, she argues...
...“Conspiracy theories are fundamentally a form of political propaganda,” says Quassim Cassam, a philosopher at the University of Warwick in Coventry, UK. Although Trump failed to overturn the election, Cassam says the former president was very successful at mobilizing his political base — and radicalizing the Republican Party...
A graphic from the article:
For Only the 3rd Time in Its Records, the CO2 Readings at Mauna Loa Are Above 417 ppm.
As I have remarked many times in this forum, and when I was writing there, the E&E forum, somewhat obsessively I keep a spreadsheet of the weekly data, reported at the Mauna Loa Carbon Dioxide Observatory, of carbon dioxide concentrations, which I use to do calculations to record the dying of our atmosphere, a triumph of fear, dogma and ignorance that did not have to be, but nonetheless is.
I have noted many times, with sadness and regret, that we on the left are not free of such fear ignorance and dogma, although I wish we were. We cannot, with justice, attribute this outcome to Ronald Reagan, George Bush the first and second, and Donald Trump. We bear responsibility, no matter how much we pat ourselves on the back for our insane, and frankly, delusional worship of so called "renewable energy."
The amount of money "invested" in so called "renewable energy" in the period between 2004 and 2018 is over 3.036 trillion dollars; dominated by solar and wind which soaked up 2.774 trillion dollars.
Source: UNEP/Bloomberg Global Investment in Renewable Energy, 2019
This is an amount that is larger than the GDP of India, a nation with 1.4 billion people in it.
It is obvious that all the money thrown at so called "renewable energy" did not work, is not working, if the definition of "working" reflects dealing with climate change. I, for one, am absolutely and irrevocably certain that even more money, tens of trillions of dollars, will not work if this is the goal, and not simply keeping the mining and semiconductor industries flush with money changing hands.
The reason is physics. The laws of physics are not determined by popular opinion, delusional or otherwise. They are independent of politics, and politicians ignore them at the peril of all humanity. The reason that so called "renewable energy" has failed, is failing and will always fail is the low energy to mass ratio associated with it, along with its intrinsic variability.
The data at Mauna Loa fluctuates with the seasons, a roughly sinusoidal curve whose axis is a quasi-linear (slightly parabolic actually) pretty much monotonically increasing line:

The annual maxima are usually seen sometime in May of any given year; the annual minima usually occur in September or October,
Here is the data from the Mauna Loa observatory for the week beginning January 31, 2021:
Up-to-date weekly average CO2 at Mauna Loa
Week beginning on January 31, 2021: 417.12 ppm
Weekly value from 1 year ago: 414.50 ppm
Weekly value from 10 years ago: 392.19 ppm
Last updated: February 7, 2021
This is only the third such measurement to ever exceed 417 ppm at the Mauna Loa observatory, going back to the 1950's. Weekly data points are available for the Mauna Loa CO2 observatory going back to the week beginning May 25, 1975, when the reading was 331.10 ppm. Last year, the annual maximum was recorded as 417.43 ppm for the week beginning May 24, 2020, and the week after, beginning May 31, 2020 recorded a value of 417.20 ppm.
In terms of the comparison with weekly measurements recorded 10 years ago, the difference recorded here, 24.93 ppm, is the 10th highest among all 10 year week to comparisons, out of 1891 such data points available in my spreadsheet.
There is considerable noise in these measurements. There has been a lot of speculation about the effect of Covid-19 on carbon dioxide accumulations in 2020, and it is possible that this year may show up as "lighter than usual" - at least for these times, although the trend in annual increases, since the first weeks of 2021 have been showing unusually mild increases over the previous year, averaging "only" 1.96 ppm higher than the same four weeks of 2020. Similarly the last 4 weeks of 2020, the weeks of December, the average was "only" 2.22 ppm.
I'm personally not mislead, since the average of all week to week comparators between weeks of 2020 and weeks of 2019 was 2.58 ppm, which, compared with values in the 20th century, is obscenely high.
Here is how the Mauna Loa observatory calculates annual increases:
The estimated uncertainty in the Mauna Loa annual mean growth rate is 0.11 ppm/yr. This estimate is based on the standard deviation of the differences between monthly mean values measured independently by the Scripps Institution of Oceanography and by NOAA/ESRL. The annual growth rate measured at Mauna is not the same as the global growth rate, but it is quite similar. One standard deviation of the annual differences MLO minus global is 0.26 ppm/year.
Using this method of calculation, there were, in the 40 year period between 1959 and 1999 five years in which the carbon dioxide concentrations of the dangerous fossil fuel waste carbon dioxide increased by more than 2.0 ppm. In the 21st century, 13 out of 20 have exceeded 2.0 ppm increases.
However, the preliminary figure for the increase, perhaps calculated differently, linked on the data page at the Mauna Loa website shows the increase for 2020 as being 2.57 ppm.
The trends are clear enough from this bar graph on the Mauna Loa website:

Annual Mean Growth Rate for Mauna Loa, Hawaii
If any of this troubles you, don't worry, be happy. Head on over to our E&E forum and read all about how some bourgeois person over there has put solar cells on the roof of his or her McMansion, and is saving money which he or she can use to buy his or her Tesla electric car.
It doesn't do much for me, but maybe you're different than I am.
Have a nice Sunday afternoon.
Profile Information
Gender: MaleCurrent location: New Jersey
Member since: 2002
Number of posts: 33,516